Monthly Market Summary: February 2023
 Investment Insights Team, Investment Strategist Team, Wealth Management
Summary: ‘Higher for longer’ prompts market rout in February
Capital markets experienced a difficult month, as renewed interest rate risk moved into focus: global equities fell by 2.9% (MSCI ACWI in USD terms) and government bonds declined by 3.5% (USD, unhedged terms). Key themes in February included:
- Global economic activity remains resilient as inflation slowly abates;
- Major central banks continue to raise interest rates with further tightening ahead;
- Kazuo Ueda revealed as the new Bank of Japan Governor.
Geopolitical developments were in focus during February. US-China tensions re-escalated after a suspected Chinese ‘spy balloon’ incurred into US airspace, prompting a pause in diplomatic talks. Elsewhere, Russia pulled out of the New START nuclear treaty, just days before the one-year anniversary of the invasion of Ukraine. Commodity prices moved lower last month: the European natural gas benchmark fell to its lowest level since August 2021; gold fell by over 5% (in USD terms), after the US dollar appreciated in February. A disappointing fourth-quarter US reporting season saw corporate earnings decline by 4.8%.
US: Consumer strength; Inflation fading; Fed hikes by 25bps
US consumer spending was remarkably strong in January: retail sales rose by 3% – rebounding from weakness in December – and ‘real’ personal consumption expenditures grew by over 1%. The ISM Manufacturing PMI also moved up to 47.7 in February. Real-time first-quarter GDP estimates are tracking at a trend-like 2.8% (q/q, annualised). Labour market tightness persisted, with the unemployment rate falling to 3.4%, its lowest reading since 1969, but average hourly earnings growth remained negative in ‘real’ terms. Headline and core CPI rates continued to edge lower to 6.4% (y/y) and 5.6% (respectively), though the Fed’s preferred inflation measure, the PCE deflator, crept (marginally) higher in January. The Fed raised its target rate range by 25bps to 4.5-4.75%, with policymakers signalling further tightening to come.
Europe: Robust activity; ECB & BoE hike by 50bps; Windsor Framework
European economic activity tilted higher: the eurozone and UK Composite PMIs expanded at a faster pace in February (mostly driven by service sector activity). This year’s recession forecasts continued to be revised away: the European Commission raised the EU’s 2023 growth forecast to 0.8%. The UK stagnated in the fourth quarter, in turn narrowly avoiding a year-end recession. Headline inflation rates moved lower again in the eurozone (8.6% y/y) and UK (10.1%) in January, though euro area core inflation edged up to a record high of 5.3%. The ECB raised its deposit rate by 50bps to 2.5% in February, with Lagarde signalling a similar-sized hike at the next meeting. The Bank of England increased its base rate by 50bps to 4% and upgraded its economic projections. The UK also struck a new post-Brexit deal with the EU over trade arrangements with Northern Ireland.
ROW: China PMIs rebound; Turkey earthquake; New BoJ Governor
Despite Chinese equities underperforming in February, economic indicators continued to rebound: the NBS manufacturing PMI rose to 52.6, while the non-manufacturing equivalent increased to 56.3. Multiple major earthquakes hit Turkey, where the mounting human and economic toll have yet to be discerned. Elsewhere, Japan’s headline inflation rate rose to 4.3% (y/y), its highest reading since 1981. Kazuo Ueda, a former member of the BoJ Board, was announced as the next Governor – his tenure should begin in April.
Performance figures (as of 28/02/2023 in local currency)
| Fixed Income | Yield | 1M % | YTD % |
|---|---|---|---|
| US 10 Yr | 3.92% | -3.2% | -0.1% |
| UK 10 Yr | 3.82% | -2.7% | 0.1% |
| Swiss 10 Yr | 1.47% | -1.3% | 1.3% |
| German 10 Yr | 2.65% | -2.7% | -0.3% |
| Global IG (hdg $) | 5.23% | -2.4% | 1.0% |
| Global HY (hdg $) | 9.14% | -1.4% | 2.4% |
| Equity Index | Level | 1M % | YTD % |
|---|---|---|---|
| MSCI World($) | 8,345 | -2.4% | 4.5% |
| S&P 500 | 3,970 | -2.4% | 3.7% |
| MSCI UK | 14,661 | 1.9% | 6.1% |
| SMI | 11,098 | -1.7% | 3.4% |
| Eurostoxx 50 | 4,238 | 1.9% | 12.1% |
| DAX | 15,365 | 1.6% | 10.4% |
| CAC | 7,268 | 2.6% | 12.4% |
| Hang Seng | 19,786 | -9.4% | 0.0% |
| MSCI EM ($) | 490 | -6.5% | 0.9% |
| Currencies (trade-weighted) | 1M % | YTD % |
|---|---|---|
| US Dollar | 2.1% | 0.0% |
| Euro | -0.3% | 0.6% |
| Yen | -2.6% | -3.0% |
| Pound Sterling | 0.4% | 0.4% |
| Swiss Franc | 0.7% | -0.8% |
| Chinese Yuan | 0.0% | -0.2% |
| Commodities | Level | 1M % | YDT % |
|---|---|---|---|
| Gold ($/oz) | 1,827 | -5.3% | 0.2% |
| Brent ($/bl) | 83.89 | -0.7% | -2.4% |
| Copper ($/t) | 8,951 | -2.7% | 7.0% |
Source: Bloomberg, Rothschild & Co.
Implied terminal policy rates
2023 peak rate estimates derived from OIS curves (%)
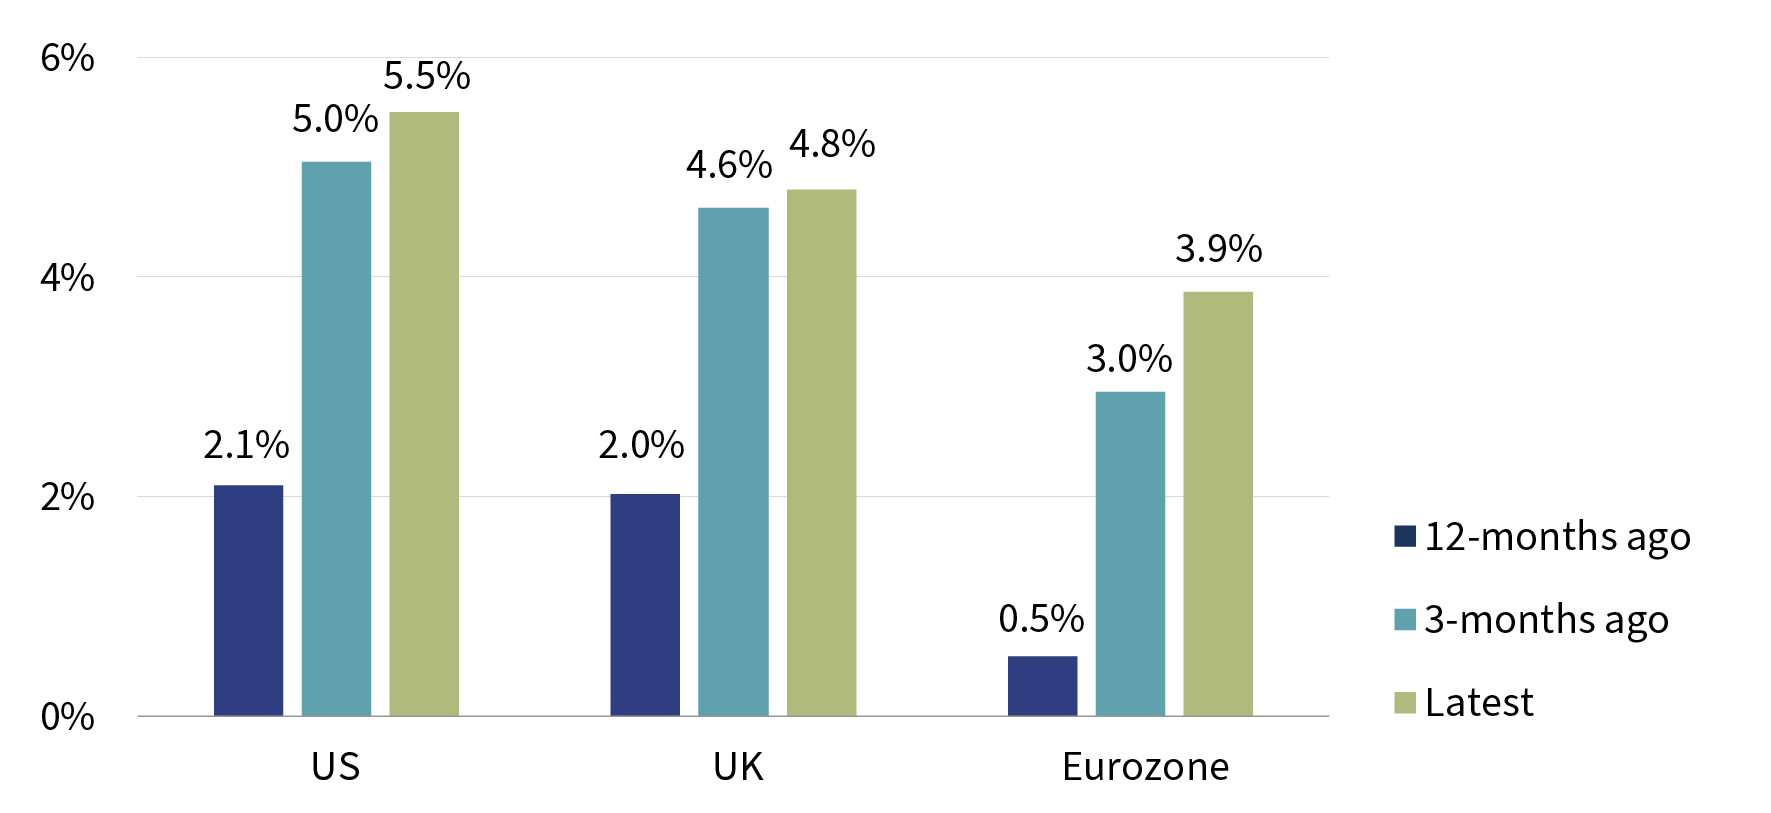
Footnote: three-month tenor; USD – SOFR; GBP – SONIA; EUR – ESTR
Figures refer to highest point estimate during 2023
Source: Bloomberg, Rothschild & Co., 01.01.2022 – 28.02.2023

Read more articles
-
Growth Equity Update
Insights
The 52nd Growth Equity Update from Patrick Wellington, Vice-Chairman of Equity Advisory.
-

Monetary policy - behind the curtain
Strategy Blog
Interest rate expectations have shifted markedly in 2026, with markets now anticipating higher rates amid persistent inflation, economic resilience and more hawkish central banks. Despite this, strong AI-driven earnings have supported equities.
-

Stories from the road
Quarterly Letter
Through deep research and direct engagement with businesses, we seek high-quality companies with strong competitive advantages, disciplined capital allocation and the ability to compound wealth over time.
-

Bringing the right advisers together
Insights
Significant wealth brings complex financial and personal decisions. Rothschild & Co helps coordinate trusted advisers, ensuring aligned, objective guidance, long-term planning and access to specialist expertise through a personalised advisory board.
-

Five stock market talking points in 2026
Strategy Blog
Global equities rose despite geopolitical tensions, as markets looked through near-term risks. AI infrastructure spending drove returns and earnings growth, valuations sent mixed signals, and corporate activity remained subdued but showed signs of recovery.