Trump tariff observations

Higher US tariffs are bad for business and growth. However, as we approach 2026, it’s clear that they have not had the destructive economic impact that many pundits asserted. As we have noted elsewhere, tariffs may have thrown sand in the wheels of global commerce, but they have not derailed it.
There have nevertheless been some eye-catching developments this year.
1. The US effective tariff rate has risen to a post-war high
The US effective tariff rate exceeded 10% in September, a post-WWII high (figure 1). The Trump administration has set its sights on ‘unfair’ bilateral trade deficits, though such protectionism doesn’t necessarily help the US in the way that the President assumes. US consumers will face higher prices and possibly a more restrictive product choice, which will dampen domestic growth as well.
Fortunately, the President may have realised this (to an extent) more recently. He has backed down from his tariff ‘Liberation Day’ proposals in April – when the ex-ante US tariff rate was estimated to be closer to 30% – and subsequent ‘trade deals’ and exemptions have muted the duty rate even further. Most major economies have also refrained from retaliating with higher duties on US goods – such action would have caused more widespread economic damage.
Some estimates suggest that the US tariff rate could still rise further from here, possibly by several percentage points, but the actual rate may still turn out to be lower than those projections (figure 1, again). Trump could strike further ‘trade deals’; importers may substitute and misreport the origins of their goods; trade may continue to be diverted through lower-tariffed nations (or even, as intended, to US suppliers). Meanwhile, the US Supreme Court is currently ruling on the legality of the POTUS’s country-level ‘reciprocal’ tariffs imposed under the International Emergency Economic Powers Act. If they are deemed to be illegal, it is unlikely to halt them completely – the administration could use other executive orders – but it will further complicate and delay their imposition.
Figure 1: US effective tariff rate and ex-ante estimates
(1821-2025, %)
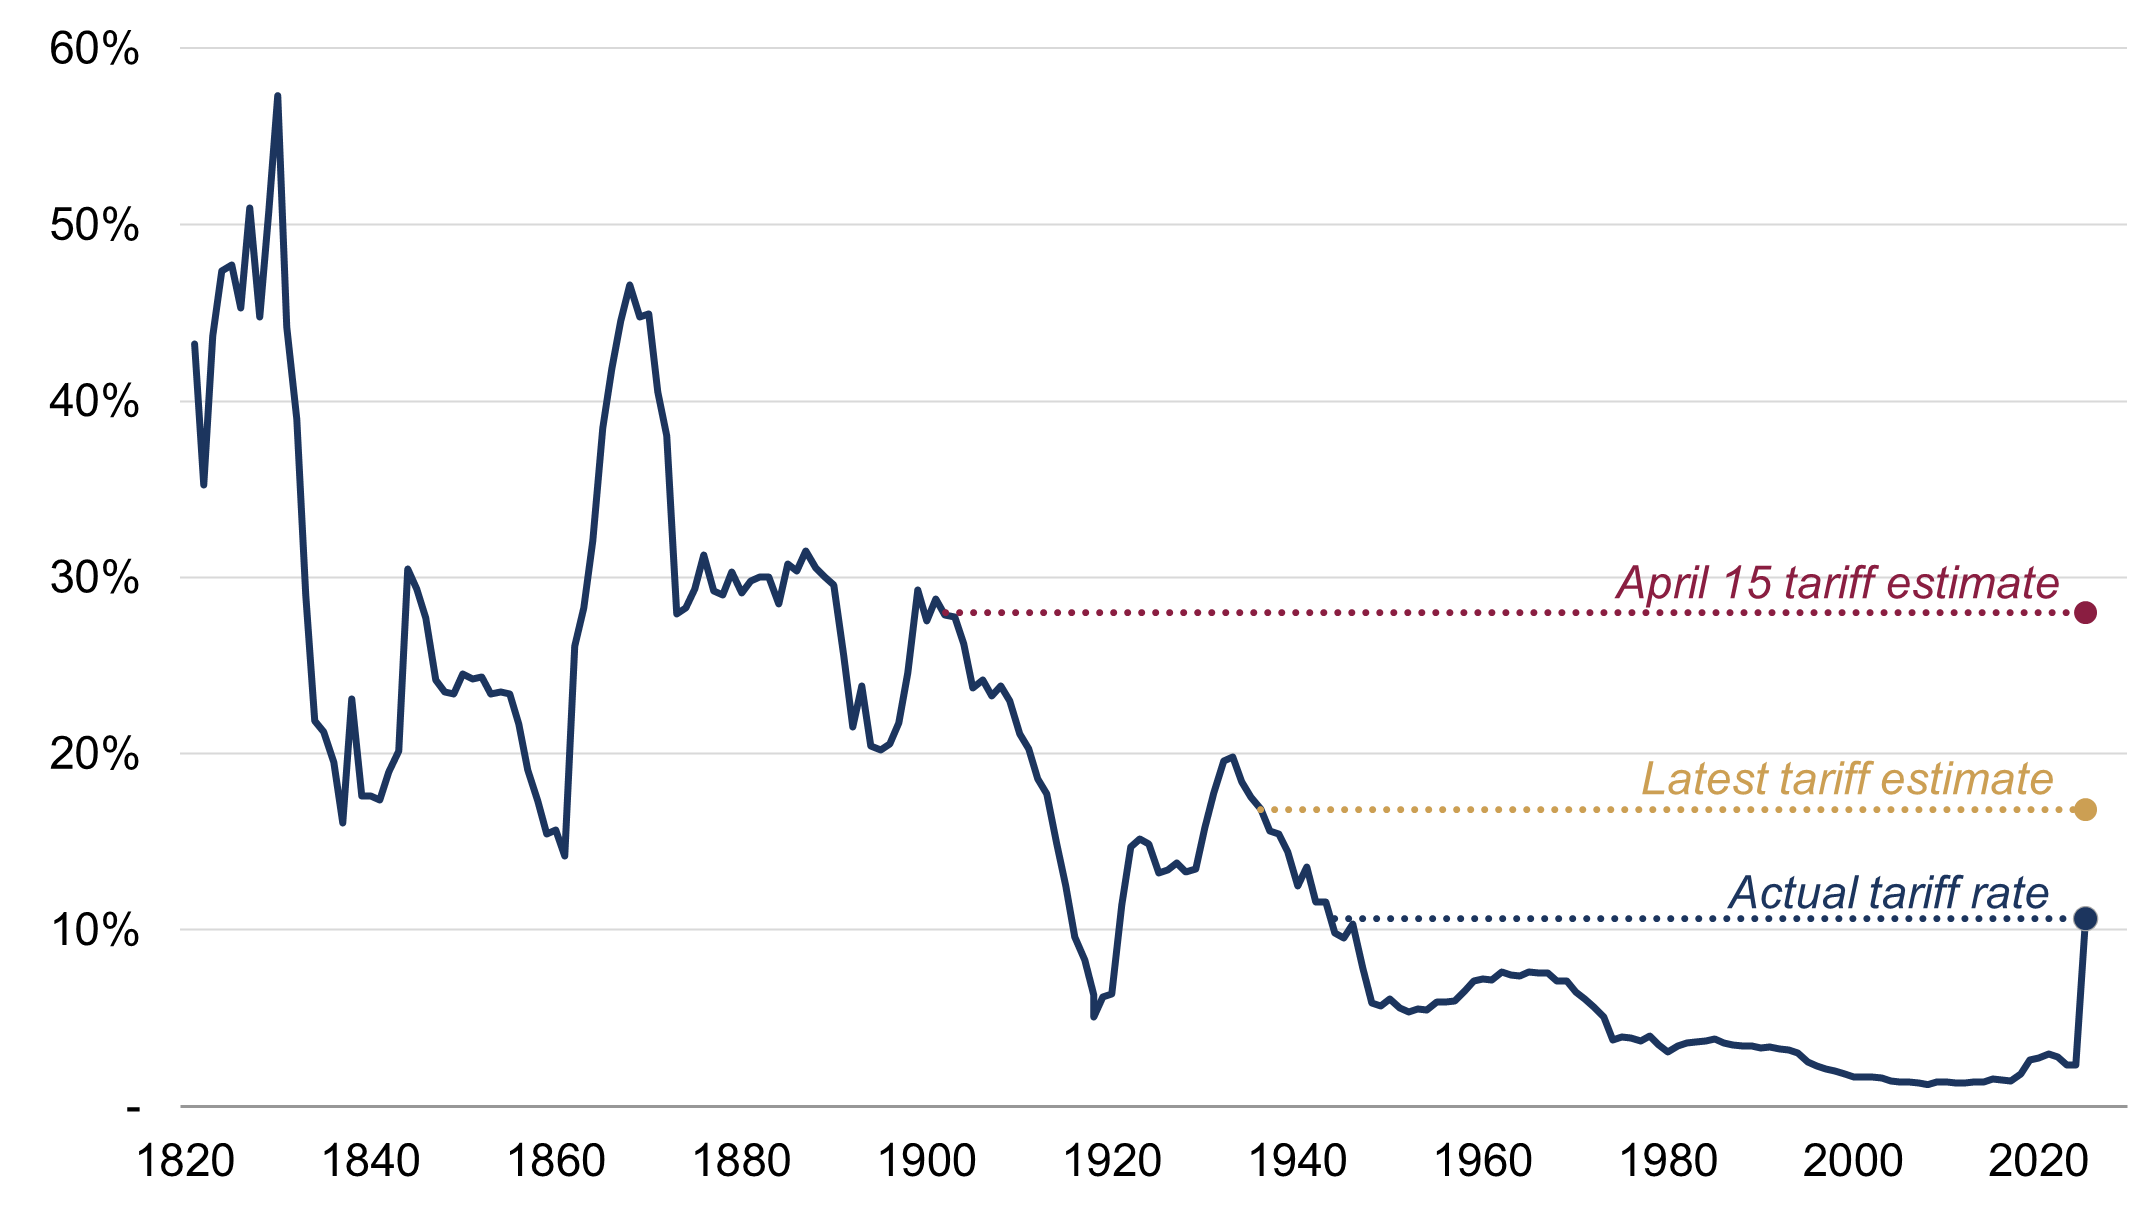
Source: Rothschild & Co, U.S. International Trade Commission, U.S. Census Bureau, The Budget Lab at Yale. Note: Latest effective tariff data is September 2025. Tariff estimates are from The Budget Lab at Yale
2. Global goods trade volumes have risen this year
Strikingly, world trade in goods volumes actually increased by 4% in the first nine months of 2025, according to the CPB World Trade Monitor. While that may not sound that impressive, it is still the fastest expansion since 2021 and is greater than the median annual growth rate since the turn of the century (figure 2). Trade patterns have admittedly been volatile this year, as both importers and exporters have tried to front-run various US tariff deadlines, but volumes appear to have settled at higher levels in recent months following greater clarity around US tariffs from the Trump administration.
Within the CPB dataset, goods export volumes grew fastest in developed Asia this year, coinciding with heightened demand for semiconductors and other AI-related products, but growth was also intact in most of the major economies (a notable exception was the UK). China also recorded export growth despite it facing much higher US tariff rates this year. However, the effective rate on Beijing has actually stayed well below some of Trump’s serious threats: for example, it rose to 48% in May, despite the President threatening a 145% duty back then, and has since fallen by roughly 10 percentage points (as of September).
Figure 2: World merchandise trade volumes
Annual growth (%)
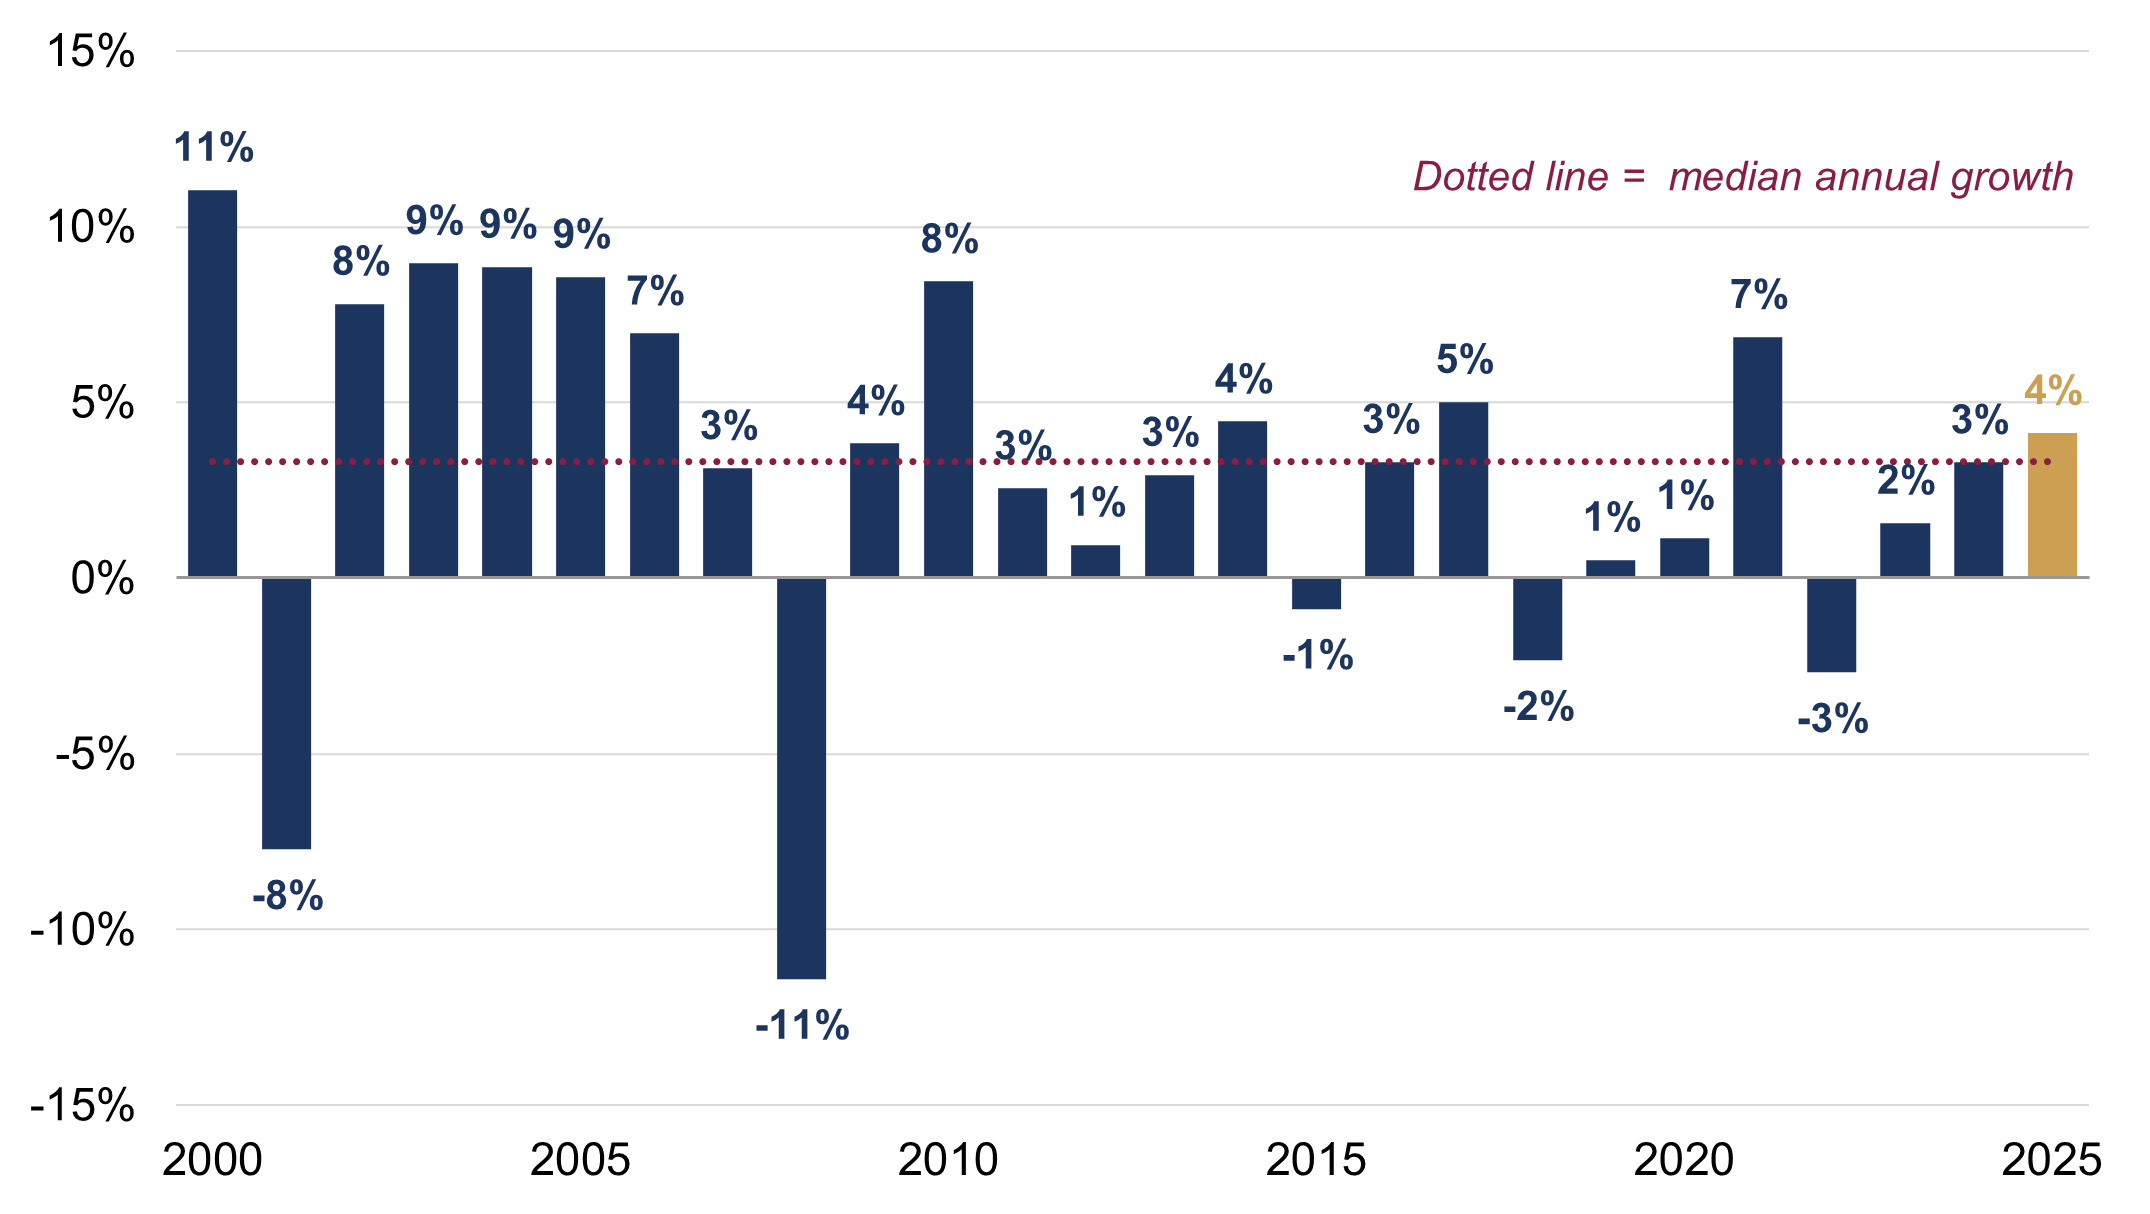
Source: Rothschild & Co, Bloomberg, CPB. Note: 2025 growth is end of 2024 to September 2025.
3. Trade has been re-routed to the US from China
Following the first US-China trade skirmish in 2018, the US’s import share from China embarked on a steady decline (figure 3), likely exacerbated by lower value-added manufacturing shifting to nearby EM Asia nations (China has prioritised advanced, higher value-added manufacturing in recent years). But US shipments from China have slumped since Trump’s second term – its import share is now the lowest since Beijing joined the World Trade Organization in 2001.
However, as noted, China’s overall export growth has been robust this year, which must of course be due to shipments to the rest of the world. The uptick in these exports may partly be due to trade being re-routed to America: Beijing exports goods to nearby countries, which are then re-exported to the US. This is evident in the US import data: the decline in the US’s import share from China has been offset by an equivalent rise in the import share from other Asian countries. Re-routing has likely worked because US effective tariff rates on nearby EM Asia nations have been far lower than on China. Most strikingly, Mexico and Canada have only experienced an actual tariff rise of a few percentage points in 2025, as most imported goods are exempted due to the US-Mexico-Canada (USMCA) agreement from 2018.
The US administration has reportedly tried to prevent these ‘trans-shipments’ from China by imposing more punitive tariffs on nations that engage in this behaviour, but it clearly has not worked to date. In fact, timelier China export data show that shipments to nearby Asia countries were still strong in November, while exports to the US plummeted by almost 30% relative to a year ago.
Figure 3: US goods import share by country/region
Three-month moving average (% of total, USD)
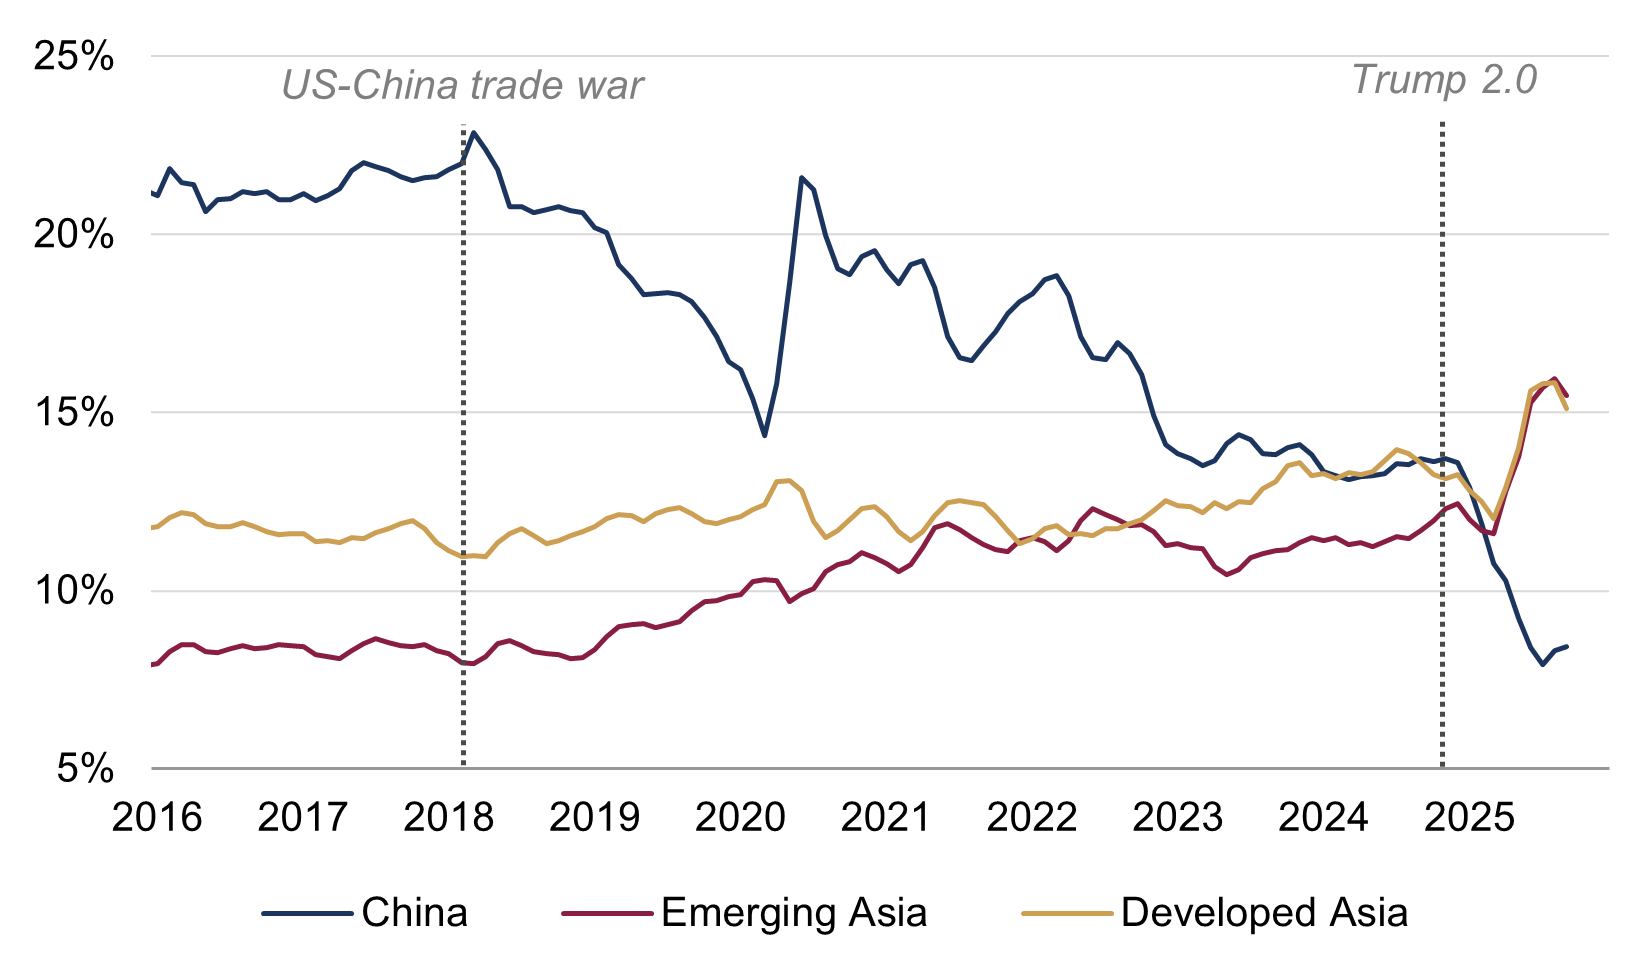
Source: Rothschild & Co, LSEG Datastream, U.S. Census Bureau. Note: Developed Asia is Japan, Singapore, South Korea and Taiwan. Emerging Asia is India, Indonesia, the Philippines, Malaysia, Myanmar, Thailand and Vietnam.
4. The US economy has remained resilient despite higher tariffs
Turning to the wider economic impact of tariffs, they have clearly not derailed aggregate US demand (the resilience of the latter is not just due to ‘AI investment’ either, as covered in our “Five Macro Myths” blog). Consumer spending has continued unabated, which reminds us that that there are many other things that influence final demand, and also, that in macroeconomic terms, the tariff revenues – an effective consumer tax – are just not that big.
They have certainly risen a lot. There has been a dramatic rise in US tariff revenues this year (figure 4), which are on track to notch over $250 billion – more than the prior three years’ tariff revenues combined. Duties collected could be even higher in 2026 as higher tariffs did not immediately kick in at the turn of this year. But that would still only equate to roughly around 1% of US GDP. That cost is also being shared across the entire supply chain, including overseas suppliers of course (there has been evidence of some countries cutting their selling prices to avoid losing sales), which has softened the blow to the final US consumer.
Moreover, the lasting impact of tariffs may be muted further – if as expected – they are effectively being recycled as tax cuts. Congress passed the so-called ‘big beautiful’ bill act earlier this year, and Trump has even floated the idea of $2,000 tariff cheques for households (though the US Tax Foundation estimated that this rebate could actually exceed the revenues raised…).
Figure 4: US net customs duties revenues
Billions (USD)
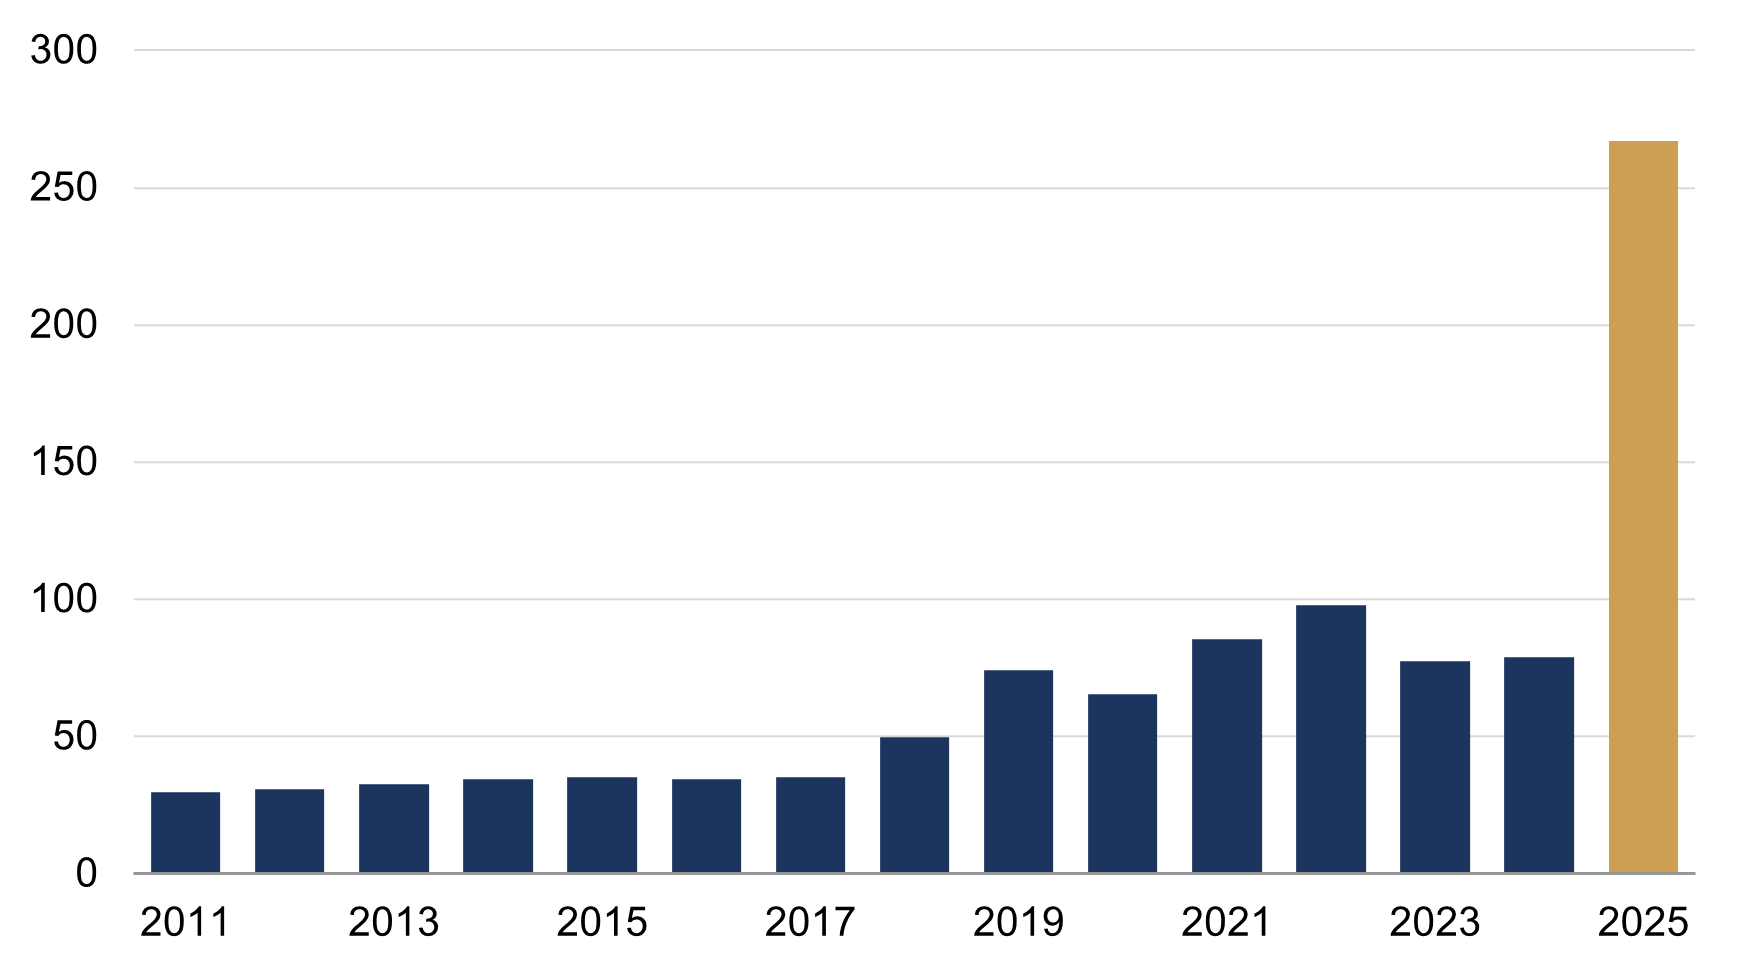
Source: Rothschild & Co, Bloomberg, US Treasury. Note: For 2025, we have assumed that the December figure is the same as November.
5. Tariffs may not meaningfully impact US CPI inflation either
Total US goods imports amount to just over 15% of US consumer expenditures. A 10% increase in their effective tariff rate might thus be expected to add 1.5 percentage points to US inflation. Meanwhile, US goods CPI has on average increased by 0.6% per year since 2000, and this year it has risen by 1.3% (albeit as of September). This perhaps suggests that roughly half of the likely additional tariffs have filtered through to the consumer.
Estimates from the Harvard Pricing Lab come to a similar conclusion, though their analysis covers the look-through impact of tariffs across all CPI categories, not just goods. They find a cumulative 0.6 percentage point contribution to US CPI (figure 5).
It’s possible that foreign suppliers and domestic distributers pass through more of the additional duties with time, as pre-tariff inventories are used up, but it is services CPI, not tariffs, which will likely continue to provide the bulk of US inflation, doubtless because of a still-tight labour market.
More generally, looking beyond the immediate effect on prices, the macro effect of tariffs may not be inflationary at all: to the extent that they dampen final demand, they will reduce inflationary pressure – unless, of course, they are recycled, as they now seem likely to be.
Figure 5: Cumulative impact of 2025 tariffs on US CPI
Deviation from trend (percentage points)
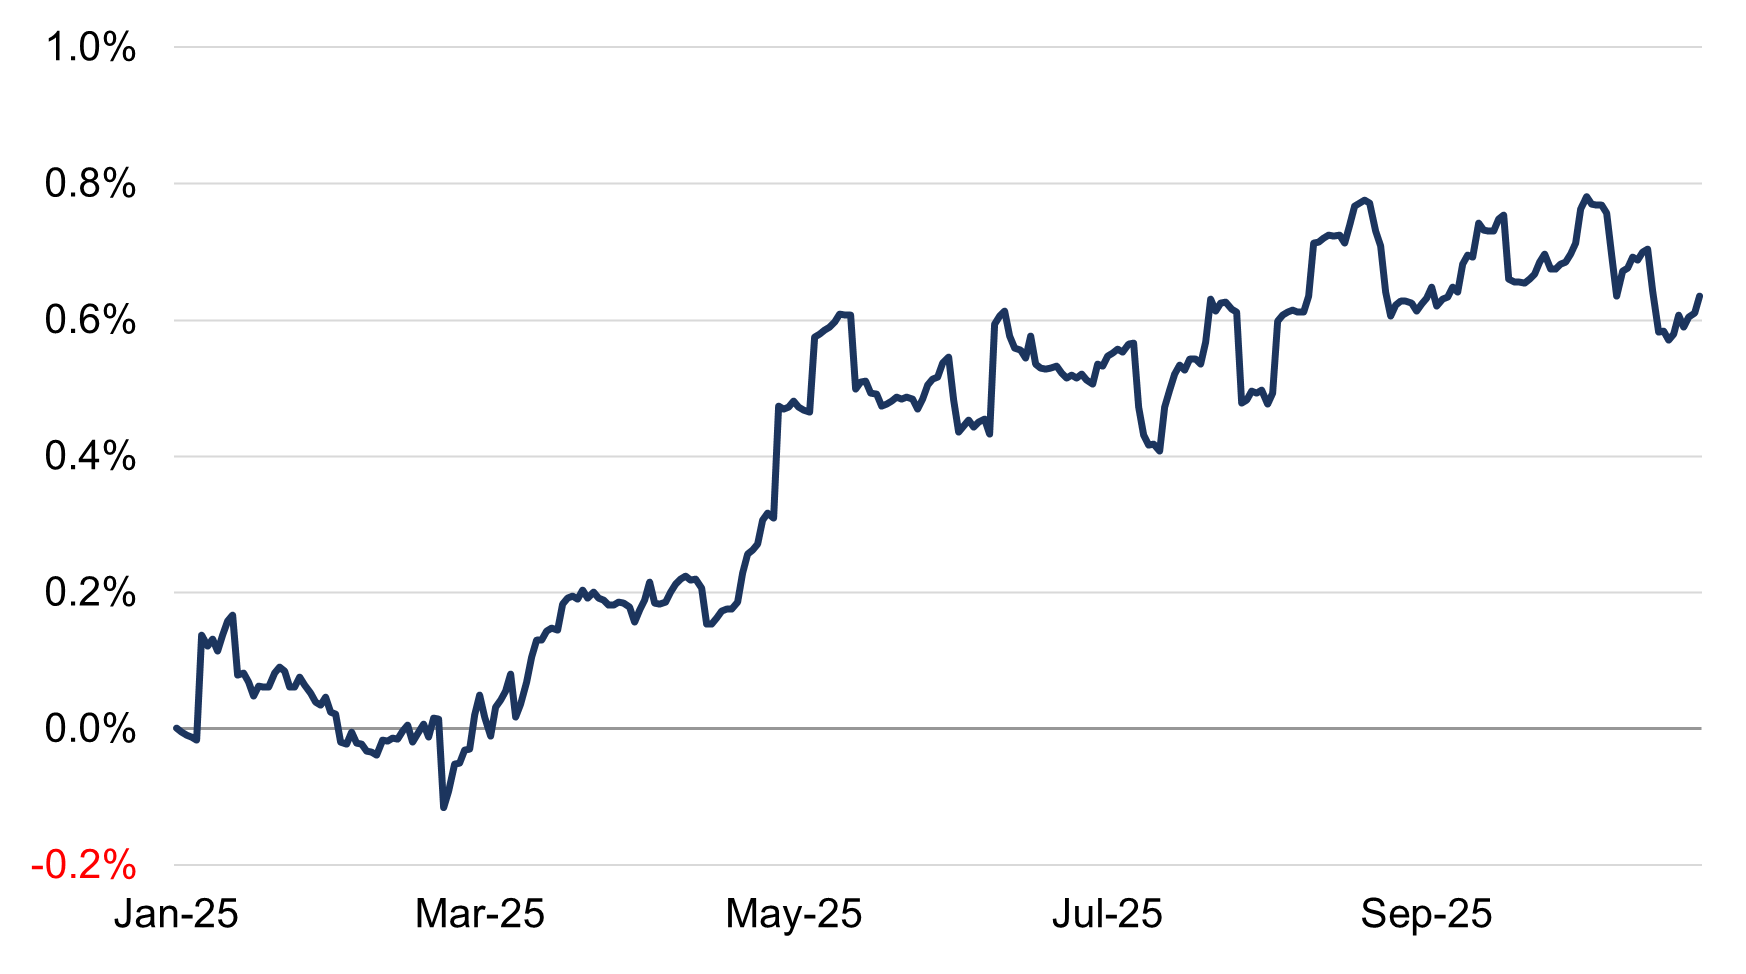
Source: Rothschild & Co, Harvard Business School Pricing Lab, Cavallo, Llamas & Vazquez (2025). Note: Deviations are measured relative to pre-tariff trends estimated over October 2024 - March 2025.
Ready to begin your journey with us?
Speak to a Client Adviser in the UK or Switzerland
Past performance is not a guide to future performance and nothing in this article constitutes advice. Although the information and data herein are obtained from sources believed to be reliable, no representation or warranty, expressed or implied, is or will be made and, save in the case of fraud, no responsibility or liability is or will be accepted by Rothschild & Co Wealth Management UK Limited as to or in relation to the fairness, accuracy or completeness of this document or the information forming the basis of this document or for any reliance placed on this document by any person whatsoever. In particular, no representation or warranty is given as to the achievement or reasonableness of any future projections, targets, estimates or forecasts contained in this document. Furthermore, all opinions and data used in this document are subject to change without prior notice.
Read more Wealth Management UK articles
-

Chips: Moore spending
Strategy Blog
Despite renewed Middle East tensions and oil price spikes, a bigger market question is whether AI investment momentum can justify soaring capital expenditure. Demand remains strong, but investors are increasingly focused on adoption, monetisation and funding sustainability, raising concerns over future earnings, valuations and capital discipline.
-

Politics on the beach
Strategy Blog
Populism is reshaping politics across the US and Europe, drawing parties away from the traditional centre. Rather than left versus right, voters increasingly divide along establishment versus anti-establishment lines, creating opportunities for populist movements and challenging conventional political assumptions.
-

Monetary policy - behind the curtain
Strategy Blog
Interest rate expectations have shifted markedly in 2026, with markets now anticipating higher rates amid persistent inflation, economic resilience and more hawkish central banks. Despite this, strong AI-driven earnings have supported equities.
-

Stories from the road
Quarterly Letter
Through deep research and direct engagement with businesses, we seek high-quality companies with strong competitive advantages, disciplined capital allocation and the ability to compound wealth over time.
-

Bringing the right advisers together
Insights
Significant wealth brings complex financial and personal decisions. Rothschild & Co helps coordinate trusted advisers, ensuring aligned, objective guidance, long-term planning and access to specialist expertise through a personalised advisory board.
-

Five stock market talking points in 2026
Strategy Blog
Global equities rose despite geopolitical tensions, as markets looked through near-term risks. AI infrastructure spending drove returns and earnings growth, valuations sent mixed signals, and corporate activity remained subdued but showed signs of recovery.