Five stock market talking points in 2026

It has been another eventful – and at times grim – year, but global equities have continued to climb the ‘wall of worry’, up by more than a tenth in dollar terms. Given we are approaching the 2026 halfway mark, we highlight five interesting stock market observations below.
1. Global stocks ‘look across the valley’
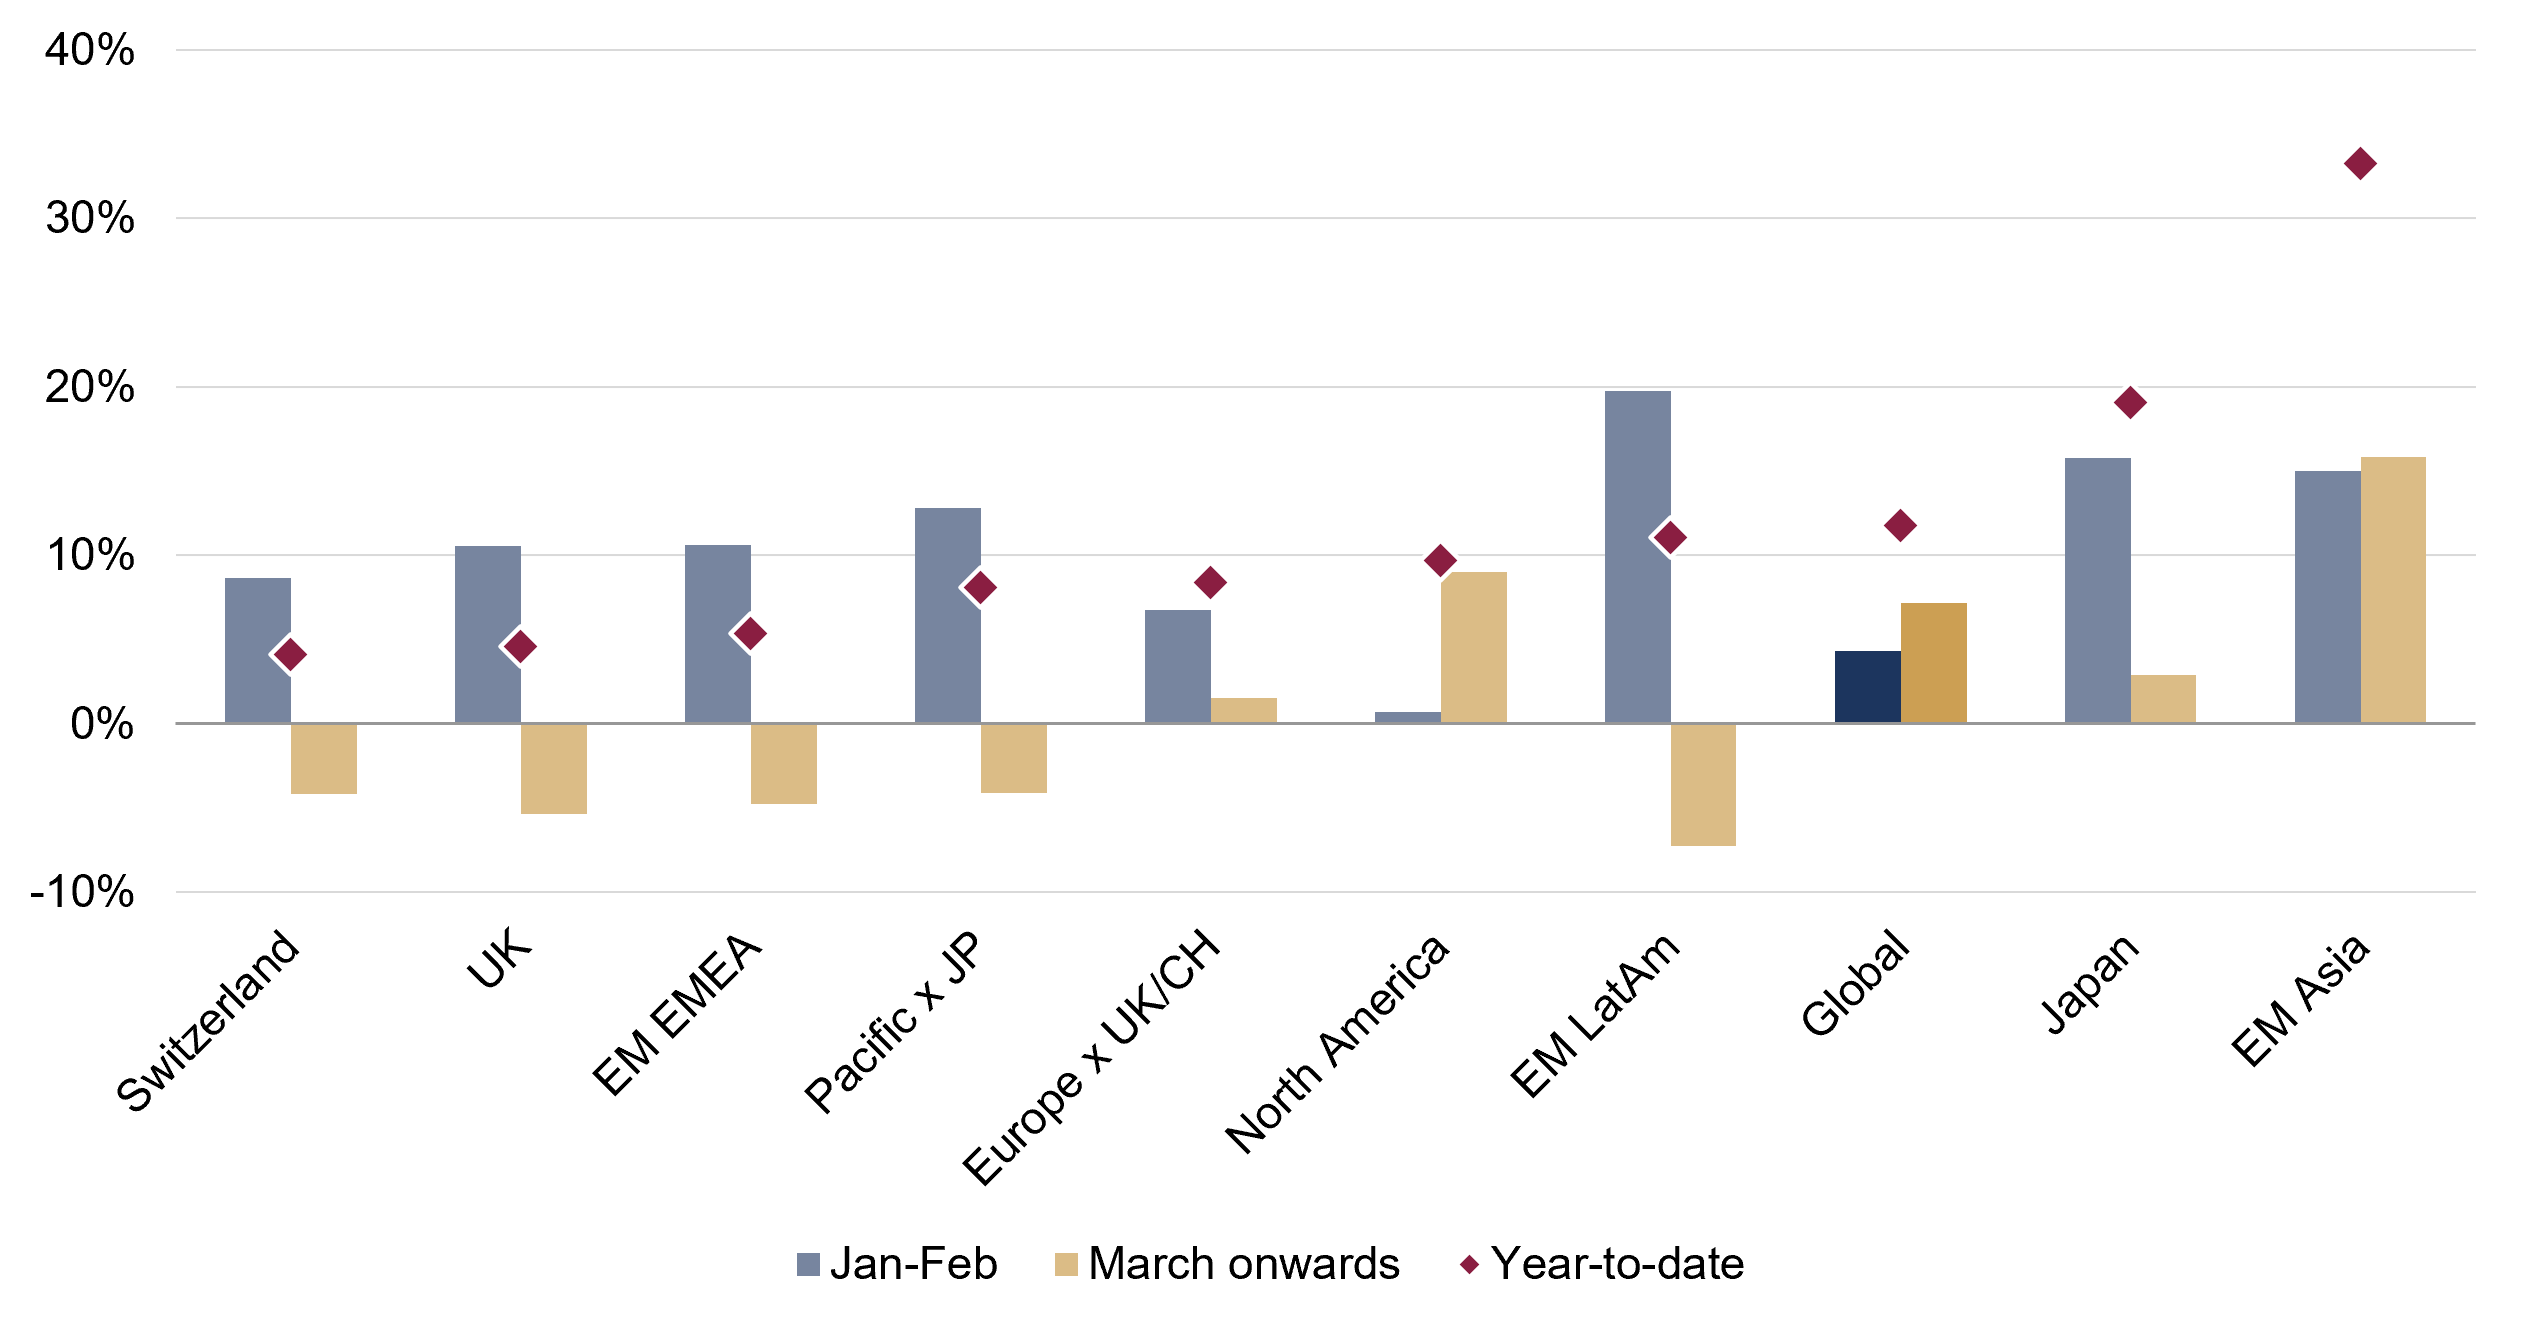
Global stocks had been drifting higher before the escalation in Middle East hostilities, and participation had also continued to broaden away from the US – the latter’s mega-cap technology names retreated during the first two months of the year. The Iran war – and the subsequent surge in the oil price – prompted a broad, if brief, sell-off through March. However, a vigorous global stock rebound ensued entering April, coinciding with the initial ceasefire agreement, led largely by the US and EM Asia (most of the major regions are down in dollar terms since the conflict started, partly due to the firmer dollar). Those two regional indices are of course heavily shaped by the booming AI datacentre build-out: the US ‘hyperscalers’1 capital expenditure estimates have continued to propel higher this year, and are expected to exceed $3 trillion between 2026-29 according to analyst projections.
Figure 1: Regional stock market returns
Ranked by 2026 year-to-date returns (USD terms, %)
Source: Rothschild & Co, Bloomberg, MSCI.
[1] Alphabet, Amazon, Meta, Microsoft, Oracle
2. The AI build-out has remained in the driving seat
It has thus been a narrow, technology-led rebound that has helped push global stocks to all-time highs, with the ‘picks and shovels’ companies – those supplying the tools and equipment to build the AI infrastructure – benefitting hugely. The semiconductor and tech hardware sectors – two of the three sub-groups within the ‘Technology’ sector – accounted for almost all the global stock market’s 12% year-to-date return in dollar terms (the contribution from semiconductor stocks has also been unusually large in regions that are not typically viewed as ‘tech’ plays, such as Europe). By contrast, ‘software’ – the other technology sub-sector – has fallen this year, ironically because AI has been deemed a threat to those business models. Outside the technology space, volatility has perhaps been more elevated: half of those global stocks are down on a year-to-date view.
Figure 2: Technology sector contribution to global stock returns (and the return distribution of underlying ‘residual’ stocks)
2026 year-to-date (USD terms, %)
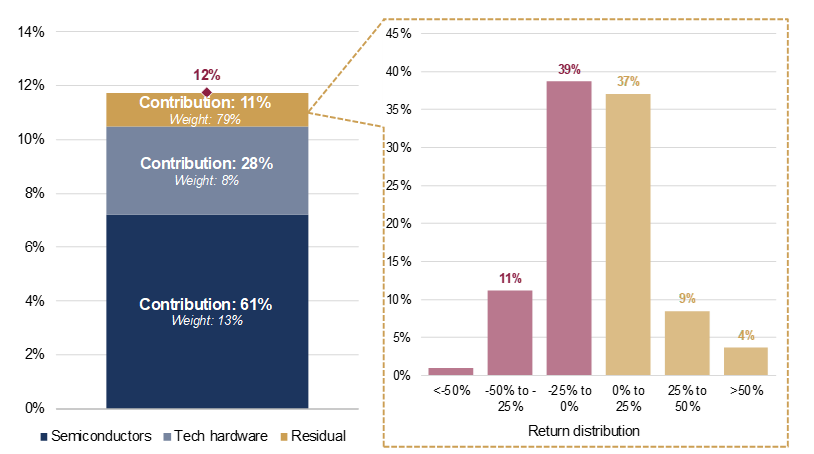
Source: Rothschild & Co, Bloomberg. Note: Index used is the Bloomberg World Index.
3. Corporate earnings growth (and expectations) are punchy
Global earnings per share (EPS) are expected to expand by more than a quarter in 2026, largely driven – unsurprisingly – by the immense AI-related spending. Thereafter, earnings are projected to decelerate though remain in double-digit territory in both 2027 and 2028 (for context, trailing – or historic – annual earnings growth has averaged 7% over the past 30 years). There is clearly some substance to today’s stock market ascent – particularly when compared to the dot-com episode of 2000 – but, these extraordinary earnings have more to do with the build-out of the technology, rather than (the more important) end-user demand. Today’s earnings outturns (and expectations) are arguably more similar to the run up to the Global Financial Crisis (GFC), which was of course partly caused by an unsustainable credit boom. Overall, the jury remains out on the sustainability of those lofty earnings growth rates.
Figure 3: Global EPS growth by year
Trailing earnings growth (blue, %) and forward earnings growth estimates (bronze, %)
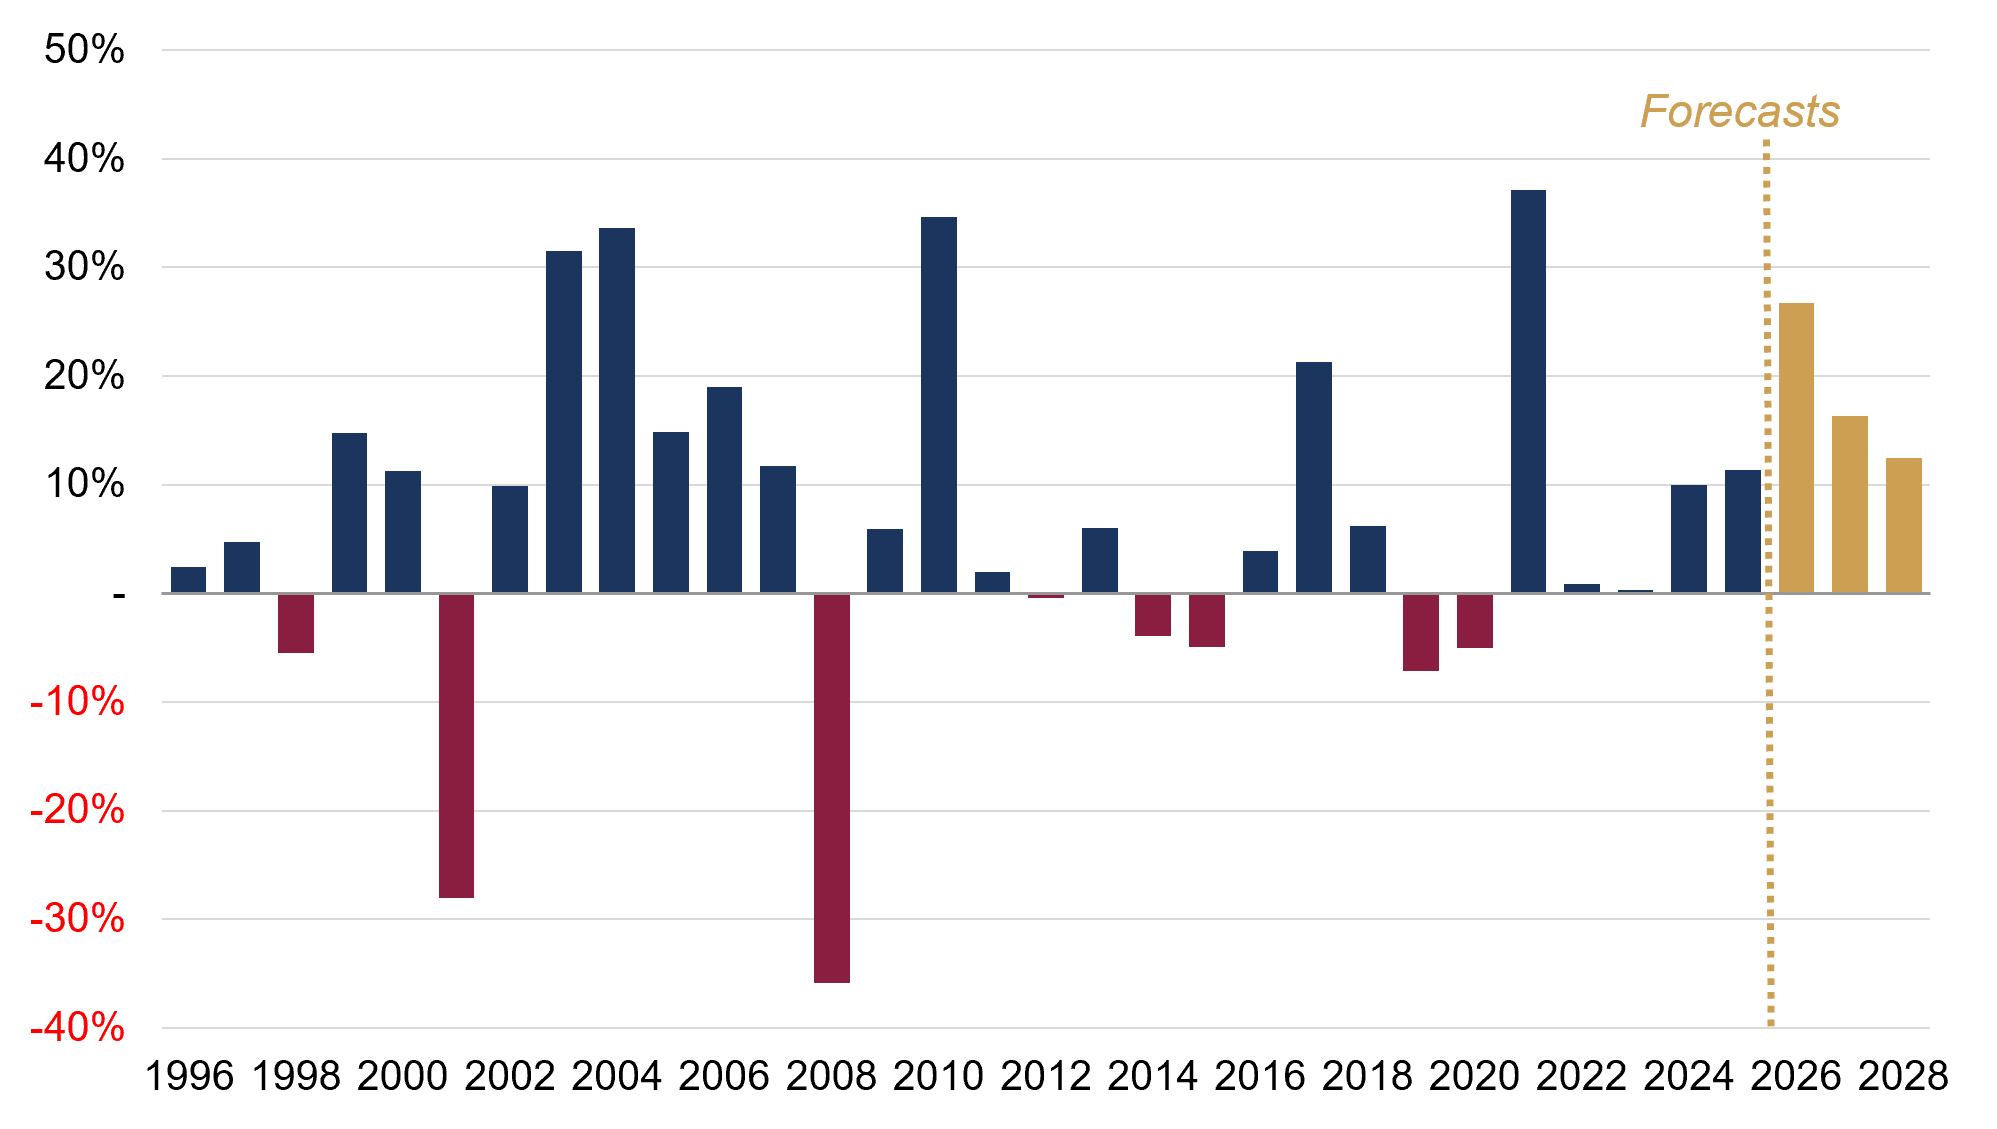
Source: Rothschild & Co, LSEG Datastream, MSCI, I/B/E/S. Note: Historic earnings growth is the annual change in 12-month trailing earnings per share (taken from the end of March in the following year, given earnings releases are lagged). Forecasts are the latest forward earnings per share growth estimate for that year.
4. Stock valuation signals are mixed
Remarkably, stock valuations based on forward – or expected – earnings have actually fallen (or de-rated) this year, as the rise in earnings growth expectations (the denominator) has outpaced price returns (the numerator). For instance, the US forward price-to-earnings ratio has fallen by 6% in 2026, leaving it somewhat close to trend (i.e., it is only modestly above its 10-year average). Conversely, the US cyclically-adjusted price-to-earnings (CAPE) ratio – our preferred longer-term stock valuation metric, which compares the inflation-adjusted price of the index with the 10-year inflation-adjusted trend in trailing earnings – is two standard deviations above trend (i.e., very expensive) and the highest it has been since the dot-com bubble. Of course, there is no ‘correct’ way to value stocks – we do not even consider profitability or interest rates here – and they are not a good short-term timing tool. Even so, it is still noteworthy that the US CAPE and forward PE spread appears to be at its widest on record.
Figure 4: US CAPE less 12-month forward PE
Ratio spread (x)
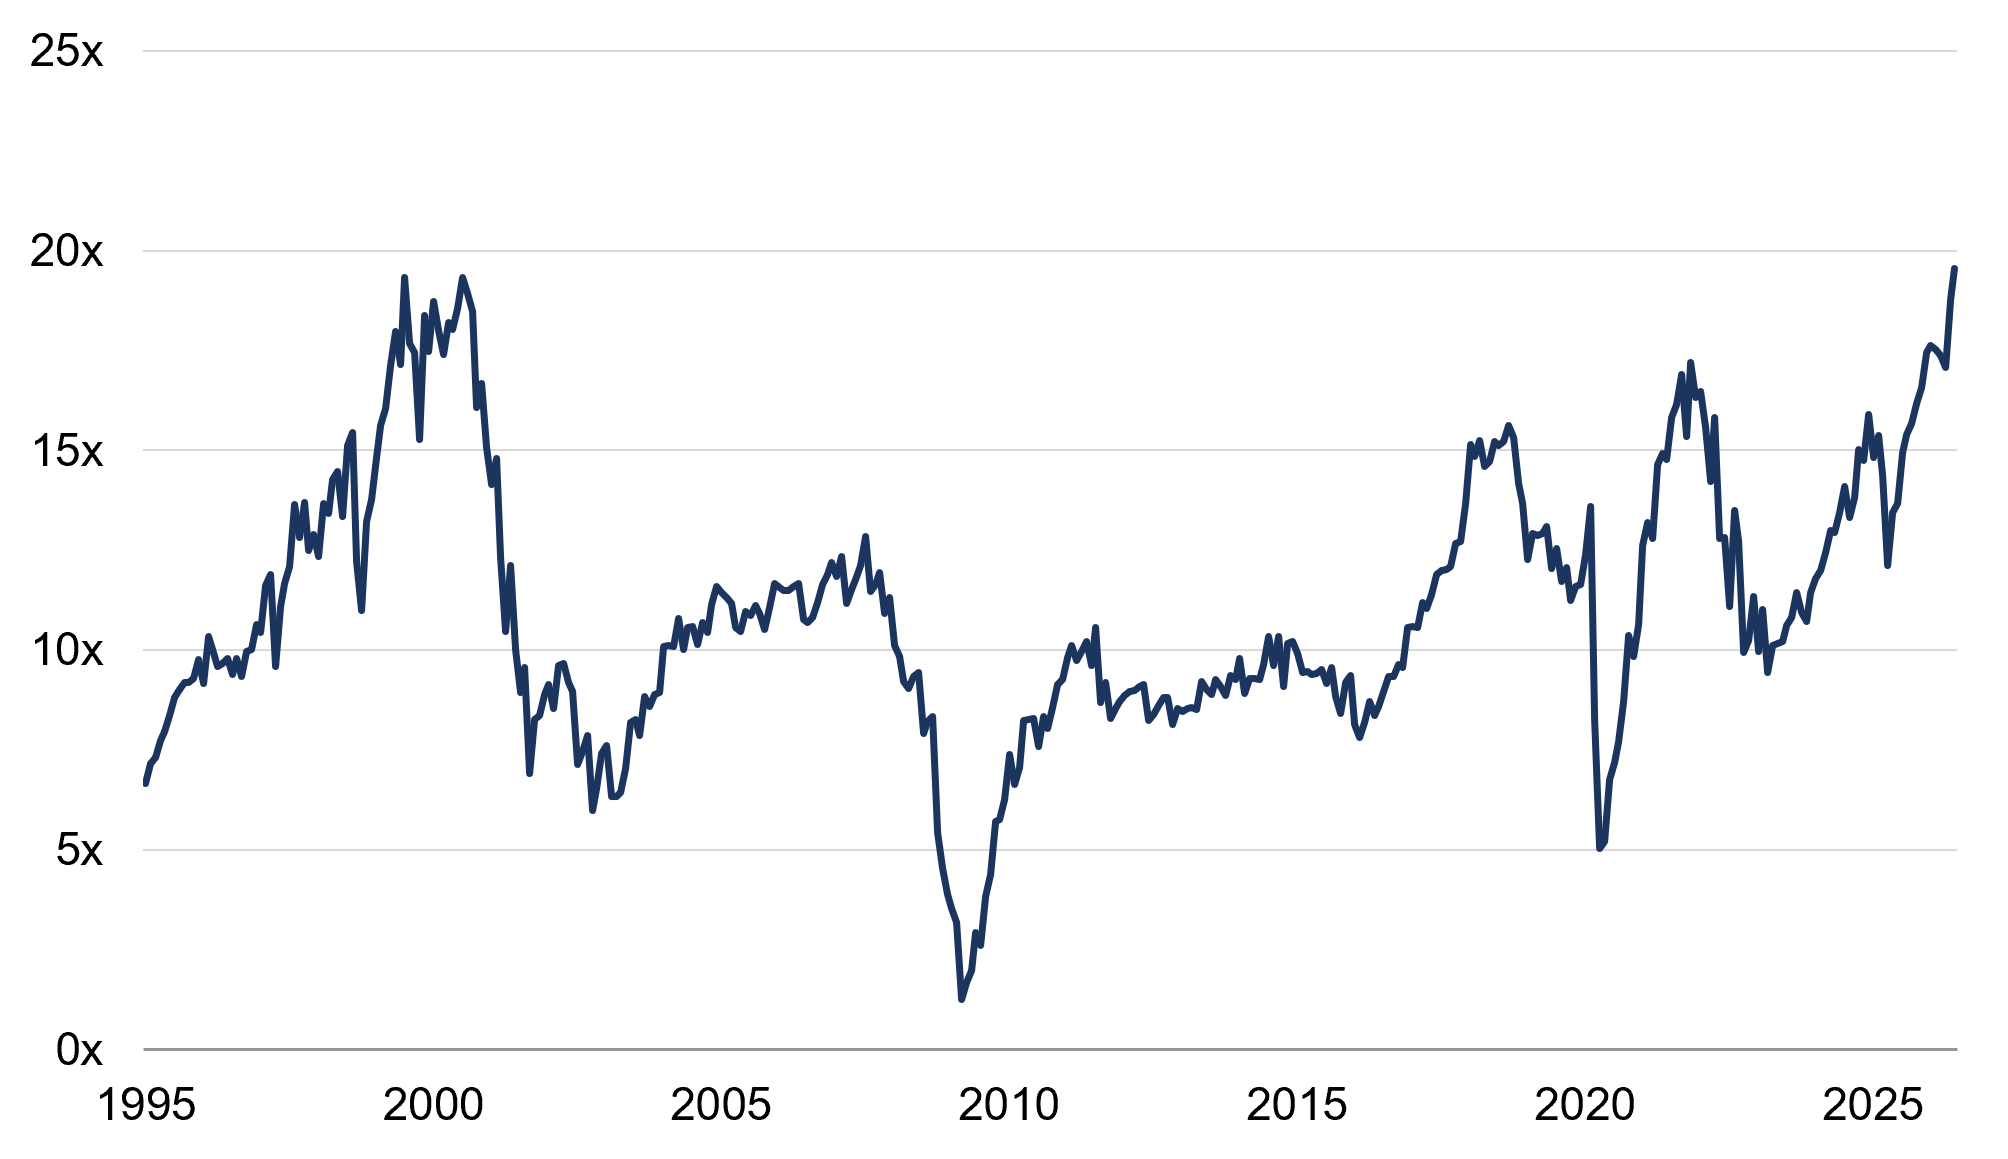
Source: Rothschild & Co, Bloomberg, MSCI, Shiller Data
5. Corporate activity is still subdued (for now)
One key difference between the current backdrop and the dot-com bubble is today’s lack of corporate activity. Some headlines have no doubt been eye-catching: SpaceX’s acquisition of xAI was the largest on record – although, both companies were founded by Musk – and the former’s IPO of $75 billion comfortably beat Saudi Aramco’s record from 2019. However, these numbers are not adjusted for inflation, and more importantly, should be viewed in the context of wider public equity market capitalisation. For now, both ‘M&A and investment’ and ‘IPO and additional issuance’ are very low relative to the total global stock market capitalisation, in contrast to the frenzy during the peak of the dot-com bubble. But that downtrend may not persist: equity issuance has picked up amid the datacentre build-out and further stock market debuts – including OpenAI’s and Anthropic’s IPOs – are on their way.
Figure 5: Global corporate activity measures
Deal volumes and issuance value relative to global stock market capitalisation (%)
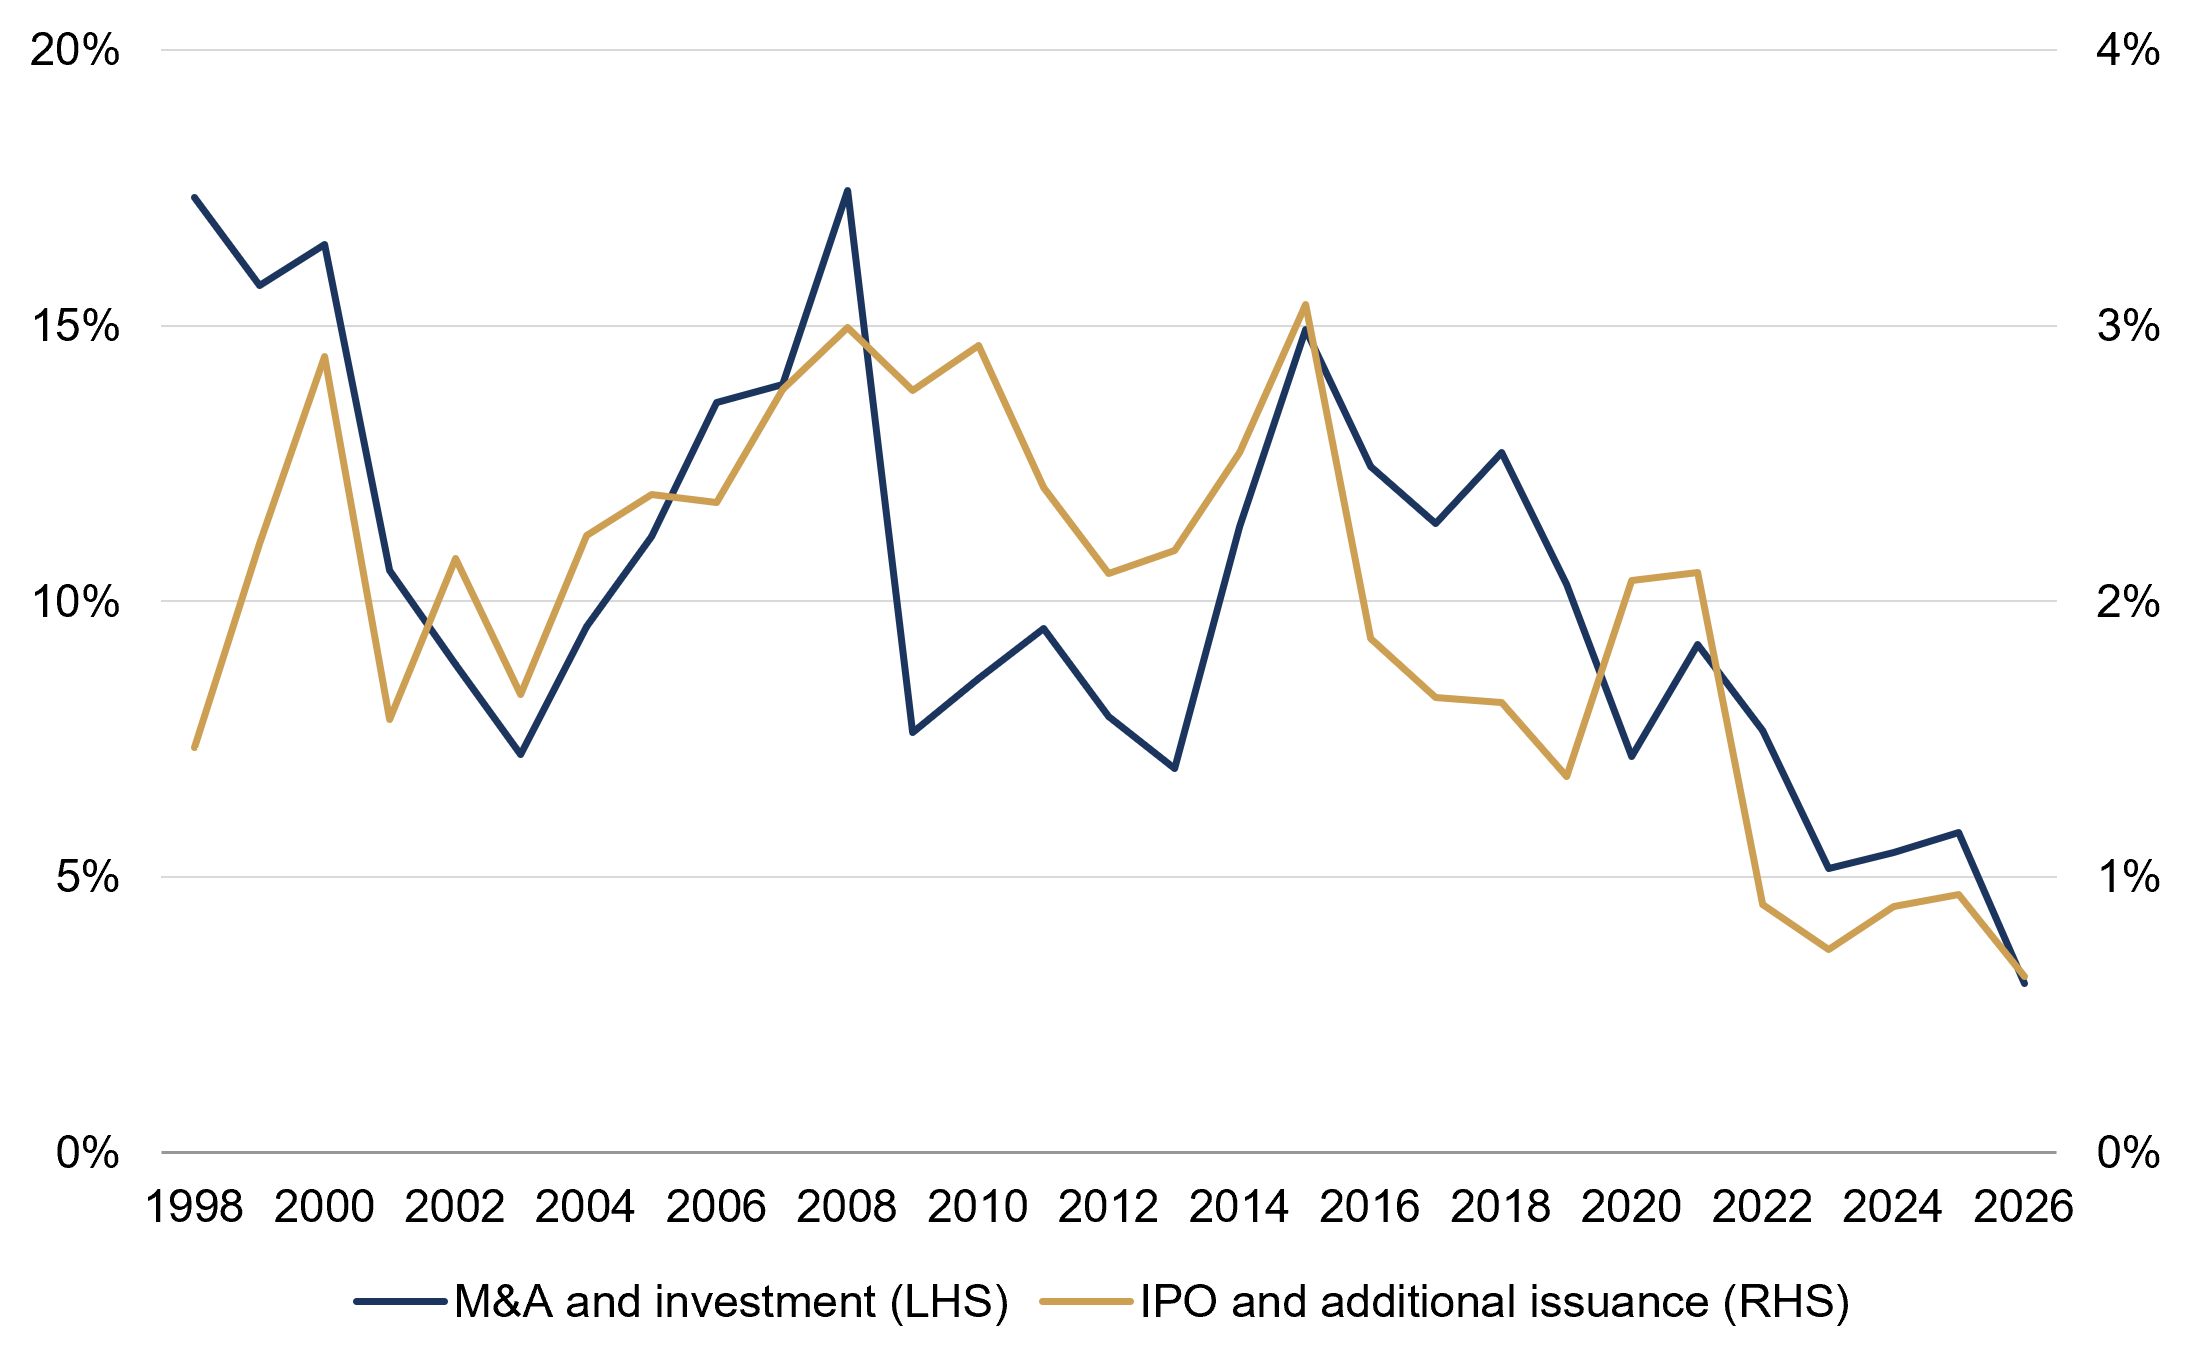
Source: Rothschild & Co, Bloomberg, LSEG Datastream, MSCI
Ready to begin your journey with us?
Speak to a Client Adviser in the UK or Switzerland
Past performance is not a guide to future performance and nothing in this article constitutes advice. Although the information and data herein are obtained from sources believed to be reliable, no representation or warranty, expressed or implied, is or will be made and, save in the case of fraud, no responsibility or liability is or will be accepted by Rothschild & Co Wealth Management UK Limited as to or in relation to the fairness, accuracy or completeness of this document or the information forming the basis of this document or for any reliance placed on this document by any person whatsoever. In particular, no representation or warranty is given as to the achievement or reasonableness of any future projections, targets, estimates or forecasts contained in this document. Furthermore, all opinions and data used in this document are subject to change without prior notice.
Read more Wealth Management UK articles
-

Monetary policy - behind the curtain
Strategy Blog
Interest rate expectations have shifted markedly in 2026, with markets now anticipating higher rates amid persistent inflation, economic resilience and more hawkish central banks. Despite this, strong AI-driven earnings have supported equities.
-

Stories from the road
Quarterly Letter
Through deep research and direct engagement with businesses, we seek high-quality companies with strong competitive advantages, disciplined capital allocation and the ability to compound wealth over time.
-

Bringing the right advisers together
Insights
Significant wealth brings complex financial and personal decisions. Rothschild & Co helps coordinate trusted advisers, ensuring aligned, objective guidance, long-term planning and access to specialist expertise through a personalised advisory board.
-

The next UK Prime Minister
Strategy Blog
Following Keir Starmer’s resignation, Andy Burnham has emerged as Labour’s likely successor. Despite political uncertainty, markets remain calm, with economic and geopolitical trends outweighing domestic politics. Significant policy change appears unlikely.
-

SpaceX: Infinity and beyond?
Strategy Blog
Markets are preparing for a wave of megacap IPOs led by SpaceX, amid strong AI-driven optimism. While liquidity should absorb issuance comfortably, questions remain around valuations, passive investing, concentration risk and index influence.
-

Macro thoughts on the Swiss referendum
Strategy Blog
Switzerland’s upcoming referendum to cap population at 10 million may tighten migration and risk EU ties, but economic impact likely limited, with living standards, markets and growth resilient over time.