Another debt ratio observation

The Congressional Budget Office (CBO) – the US fiscal watchdog – publishes a long-term budget outlook document each year, which includes a 30-year projection for US government debt relative to GDP. Traditionally, it’s a gloomy view: the debt ratio is usually projected to trend higher, in some cases almost doubling by year 30 (figure 1).
Figure 1: US government debt ratio projections by year
Federal debt held by the public (30-year forecast, %)
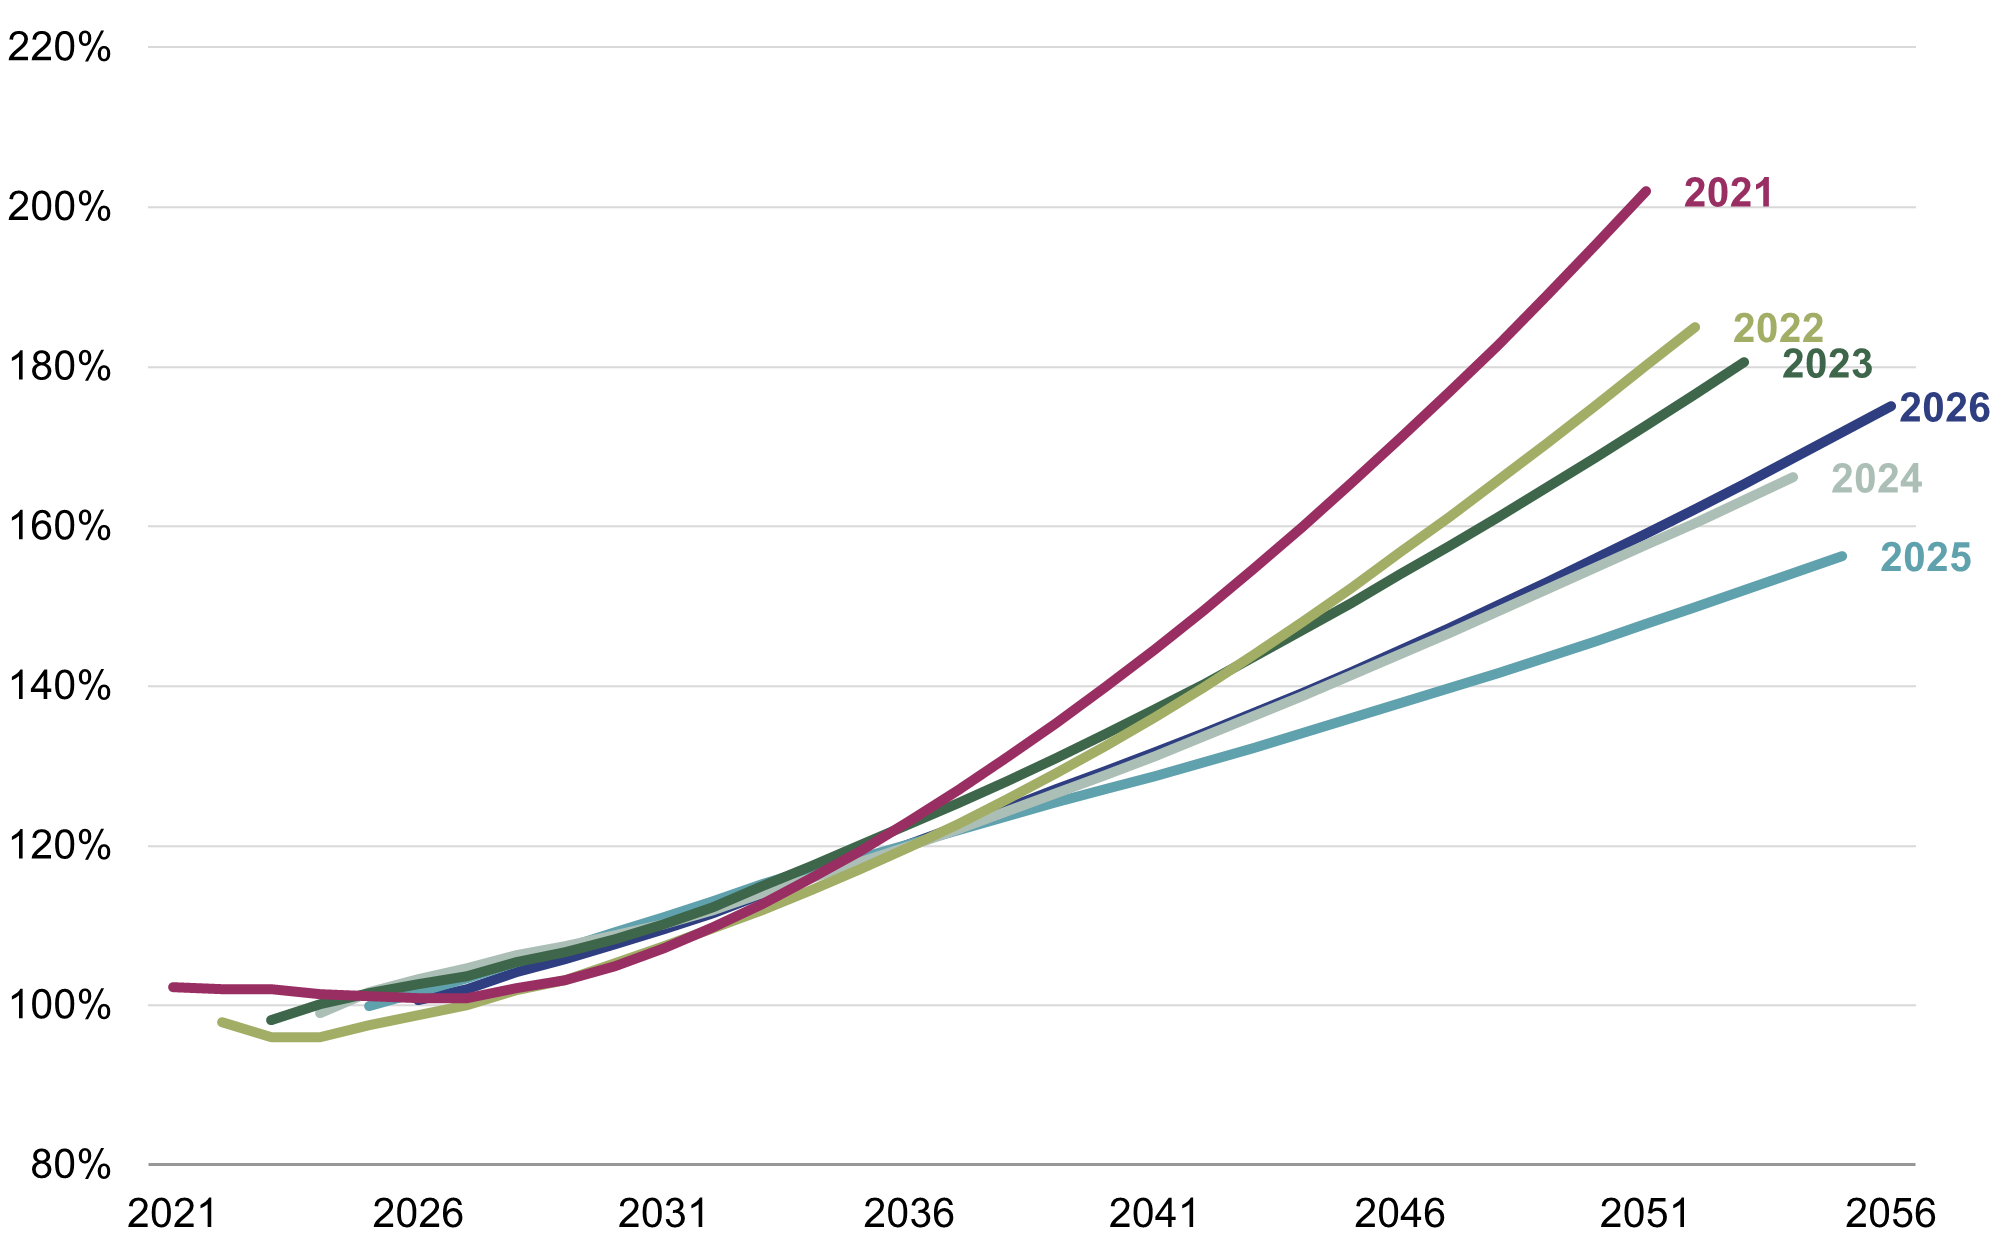
Source: Rothschild & Co, Congressional Budget Office. Note: Projections are taken from the latest CBO update in each respective year.
However, the evolution of the CBO’s projections may have gone unnoticed. As figure 1 shows, they have improved hugely since the pandemic: the final ‘year 30’ figure from 2025 was close to 50 percentage points below that of 2021 (the equivalent of Germany’s entire net government debt ratio). The 2026 forecast admittedly was slightly worse, perhaps coinciding with the Trump administration’s “big, beautiful bill”, but it is nevertheless well below the 2021 estimate.
What happened then between the 2021 and 2025 projections, particularly as fiscal concerns seemingly mounted over that period?
The answer is likely a technical one, related to the sensitivities of long-term forecasts. Minor adjustments to the inputs – expected government spending; tax revenues; interest rates; GDP growth – which may seem like rounding errors can compound remarkably, causing significantly different profiles on a 30-year view.
For example, in the gloomiest recent publication, that from 2021, the CBO plotted an alternative scenario (not shown here) in which productivity grew by 0.5 percentage points faster than in the base-case projection. The resulting US debt ratio was nearly 50 (!) percentage points lower. (note: this could be particularly pertinent if today’s AI developments do indeed eventually boost productivity growth). They also showed that if federal borrowing rates were 0.05 percentage points lower than the baseline forecast – and that differential continued to widen by that amount each year thereafter – the final US debt ratio would be more than 40 percentage points lower. Clearly, a flat-to-down US debt profile is not unthinkable in 30 years’ time.
Meanwhile, ‘bond vigilante’ chatter has seemingly re-emerged in light of the recent rise in government bond yields. The idea is that bond buyers (the so-called ‘vigilantes’) punish governments for a lack of fiscal discipline by demanding higher yields.
We’ve often noted that this is a misleading caricature: fiscal – or debt ratio – concerns are not the main drivers of bond yields. Figure 1 seems to support this view, too. Despite the big improvement in the US’s 30-year projected debt profile, the US 30-year government bond yield has obviously risen since 2021 (and by a lot). Instead, higher inflation and the normalisation of interest rates – i.e., the business cycle – are why bond yields have surged over that period.
There are of course occasions where big fiscal announcements do drive local bond yields higher, but the moves are often short lived. A longer-lasting impact could occur if the bigger borrowing were to reflect greater public spending, and if this were itself to push inflation higher, but this is not usually the source of cyclical pressures. That recent rise in longer-dated yields likely reflects the re-emergence in Middle East hostilities and associated inflation risk, and central banks’ subsequent hawkish rhetoric (rather than any sudden re-think of fiscal sustainability).
Ready to begin your journey with us?
Speak to a Client Adviser in the UK or Switzerland
Past performance is not a guide to future performance and nothing in this article constitutes advice. Although the information and data herein are obtained from sources believed to be reliable, no representation or warranty, expressed or implied, is or will be made and, save in the case of fraud, no responsibility or liability is or will be accepted by Rothschild & Co Wealth Management UK Limited as to or in relation to the fairness, accuracy or completeness of this document or the information forming the basis of this document or for any reliance placed on this document by any person whatsoever. In particular, no representation or warranty is given as to the achievement or reasonableness of any future projections, targets, estimates or forecasts contained in this document. Furthermore, all opinions and data used in this document are subject to change without prior notice.
Read more Wealth Management UK articles
-

Chips: Moore spending
Strategy Blog
Despite renewed Middle East tensions and oil price spikes, a bigger market question is whether AI investment momentum can justify soaring capital expenditure. Demand remains strong, but investors are increasingly focused on adoption, monetisation and funding sustainability, raising concerns over future earnings, valuations and capital discipline.
-

Politics on the beach
Strategy Blog
Populism is reshaping politics across the US and Europe, drawing parties away from the traditional centre. Rather than left versus right, voters increasingly divide along establishment versus anti-establishment lines, creating opportunities for populist movements and challenging conventional political assumptions.
-

Monetary policy - behind the curtain
Strategy Blog
Interest rate expectations have shifted markedly in 2026, with markets now anticipating higher rates amid persistent inflation, economic resilience and more hawkish central banks. Despite this, strong AI-driven earnings have supported equities.
-

Stories from the road
Quarterly Letter
Through deep research and direct engagement with businesses, we seek high-quality companies with strong competitive advantages, disciplined capital allocation and the ability to compound wealth over time.
-

Bringing the right advisers together
Insights
Significant wealth brings complex financial and personal decisions. Rothschild & Co helps coordinate trusted advisers, ensuring aligned, objective guidance, long-term planning and access to specialist expertise through a personalised advisory board.
-

Five stock market talking points in 2026
Strategy Blog
Global equities rose despite geopolitical tensions, as markets looked through near-term risks. AI infrastructure spending drove returns and earnings growth, valuations sent mixed signals, and corporate activity remained subdued but showed signs of recovery.