Supply chain update

There have been signs of stress in global supply chains in recent months, but on balance they have remained resilient (so far). Below are some of the latest observations.
1. Flows through the Hormuz are at a standstill
The Strait of Hormuz has been blockaded, and trade flowing through it – typically including one fifth of global oil and liquified natural gas supply – has collapsed. There are few viable alternative transit routes, and those which do exist – mostly going via the Red Sea and then the Suez Canal or Bab el-Mandeb Strait – are not visibly busier than usual.
However, there has recently been an uptick in longer transits around the Cape of Good Hope, Africa’s most southern point (figure 1). In fact, this alternative has been used more frequently ever since the Israel-Hamas War erupted in late 2023. Transit volumes around the Cape route have roughly doubled since then, offsetting a coincident decline in volumes through the Red Sea, and this ‘new’ Europe-Asia shipping route may now be utilised even more often (note: on a longer-term view, new pipelines and other trade routings may be used to bypass the Strait more permanently).
Figure 1: Transit trade volumes in key maritime chokepoints
Seven day moving average (metric tonnes, millions)
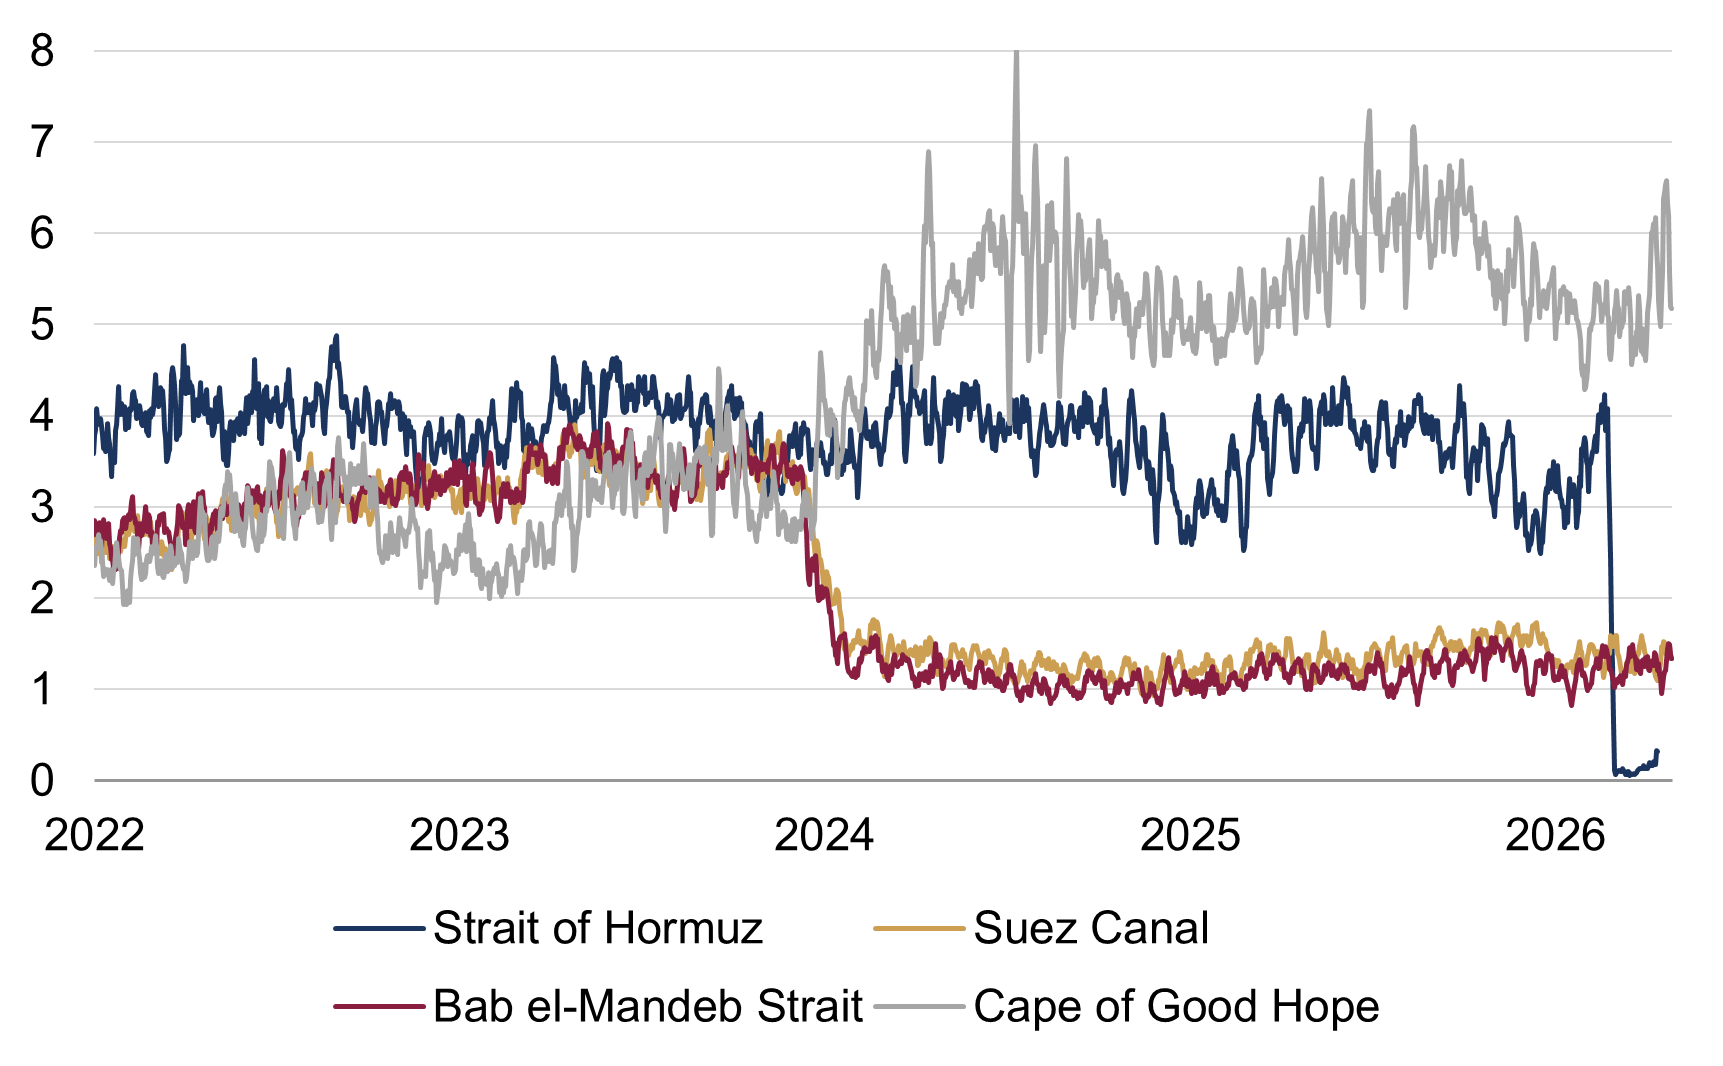
Source: Rothschild & Co, IMF, UN Global Platform, PortWatch. Note: Daily data as of 3 May 2026 (except for Strait of Hormuz data which is only available until 19 April) . Trade volumes consist of container, dry bulk, general cargo, roll-on/roll-off and tanker.
2. Business surveys highlight longer delivery times
Meanwhile, we can assess whether companies are facing energy and other supply-related issues by tracking the widely-watched Purchasing Managers’ Index (PMI) business survey sub-indices, such as the “supplier deliveries” one. For context, the PMIs are diffusion indices, so reflect the rate of change in conditions: companies are asked if delivery times have lengthened, shortened or stayed the same relative to the prior month. A value of ‘50’ corresponds to neutral – or “no change” in – conditions, with a higher reading equating to more firms reporting delays (and vice versa). While the data do not reflect the exact magnitude of the change in delivery times, an extreme reading can still imply a highly disruptive supply shock.
The US Institute for Supply Management (ISM) PMIs – which perhaps offer the most comprehensive dataset – did report longer delivery times in April, particularly in the manufacturing sector (figure 2). That said, the rise in this “supplier deliveries” sub-index has not yet been that dramatic, and is (for example) much smaller than at the onset of the pandemic.
Figure 2: US ISM manufacturing and services PMIs: Supplier Deliveries
Diffusion indices (50 = ‘no change’; 0-100 scale)
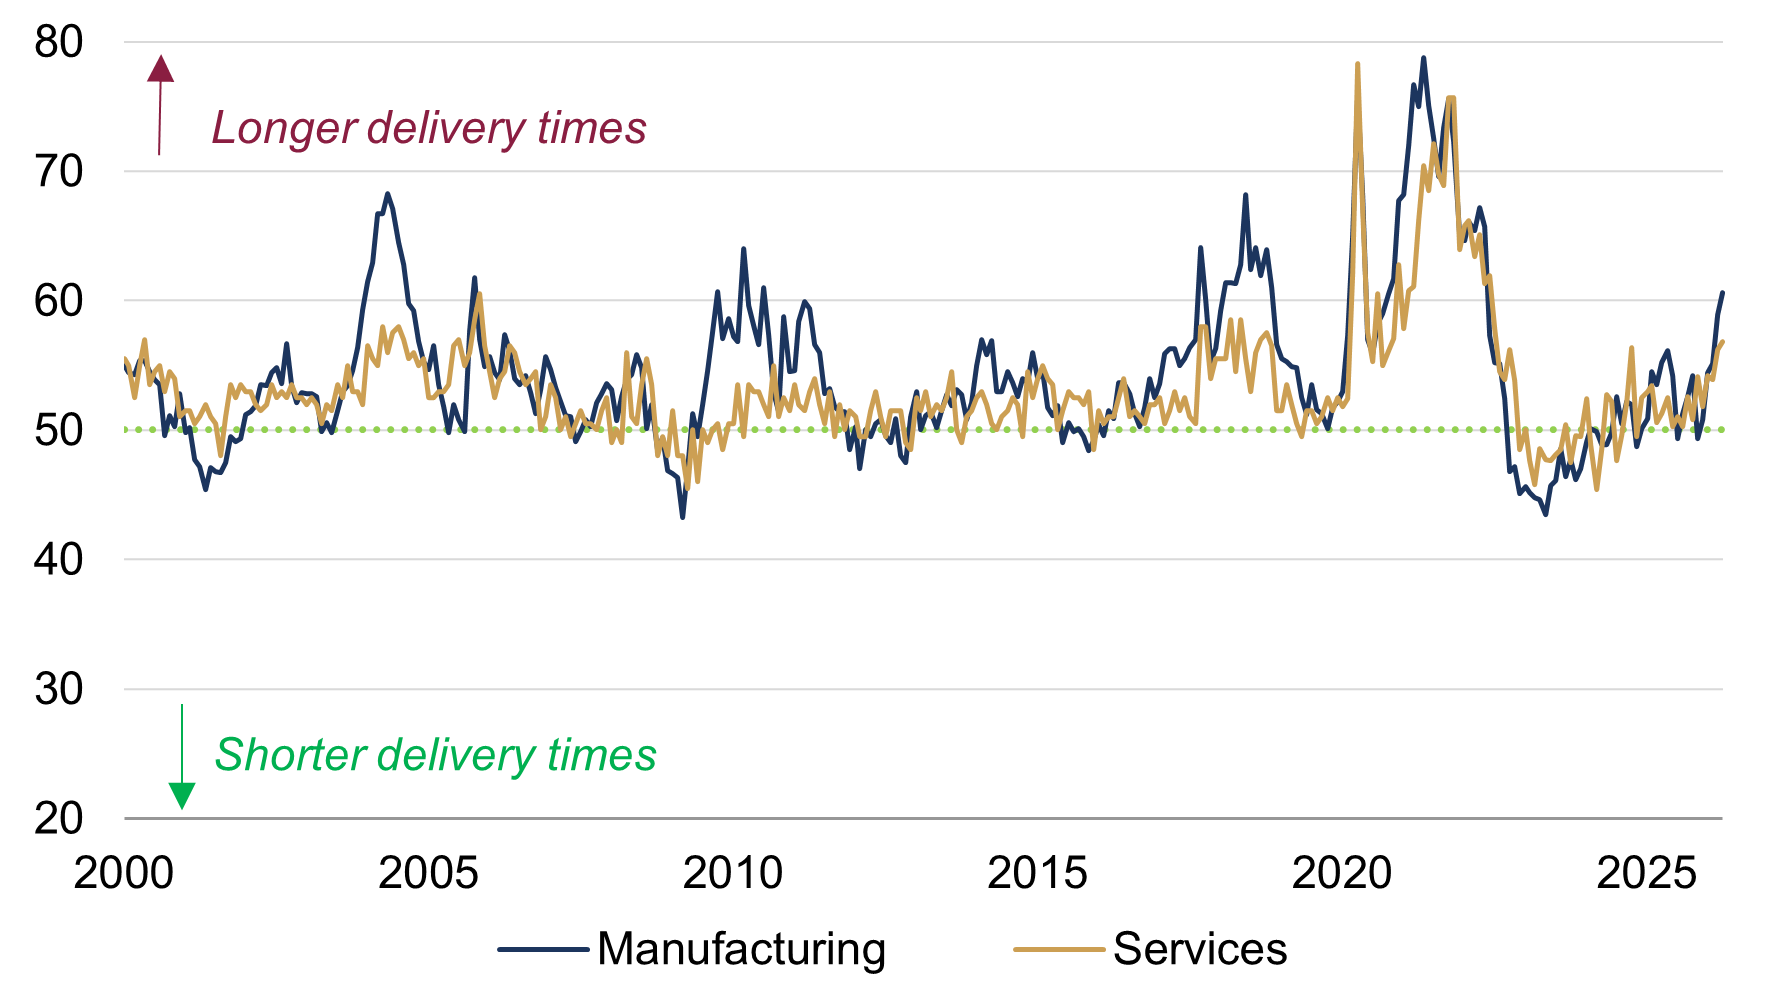
Source: Rothschild & Co, Bloomberg, Institute for Supply Management. Note: Monthly data as of April 2026.
3. Global shipping rates have only increased modestly
Spot container shipping rates have also not risen meaningfully, another indication that supply shortages are not yet biting that hard. The Drewry World Container Index – which combines freight rates from eight major global shipping routes – can reflect periods of big demand-supply imbalances, as it did during the post-pandemic supply chain stress. Yet, it has only risen by a tenth since the start of the war and has in fact been stable for more than a month, with today’s spot rate nearly 80% below its 2021 high (figure 3). Strikingly, spot rates from Europe to Asia (and vice versa) have not risen by as much as the global benchmark since the conflict started, which suggests that shippers located outside the Middle East can perhaps cope with diverting trade through alternative routes (such as the noted Cape of Good Hope route).
Figure 3: World Container Index
Spot container freight rate (USD per 40-foot container, thousands)
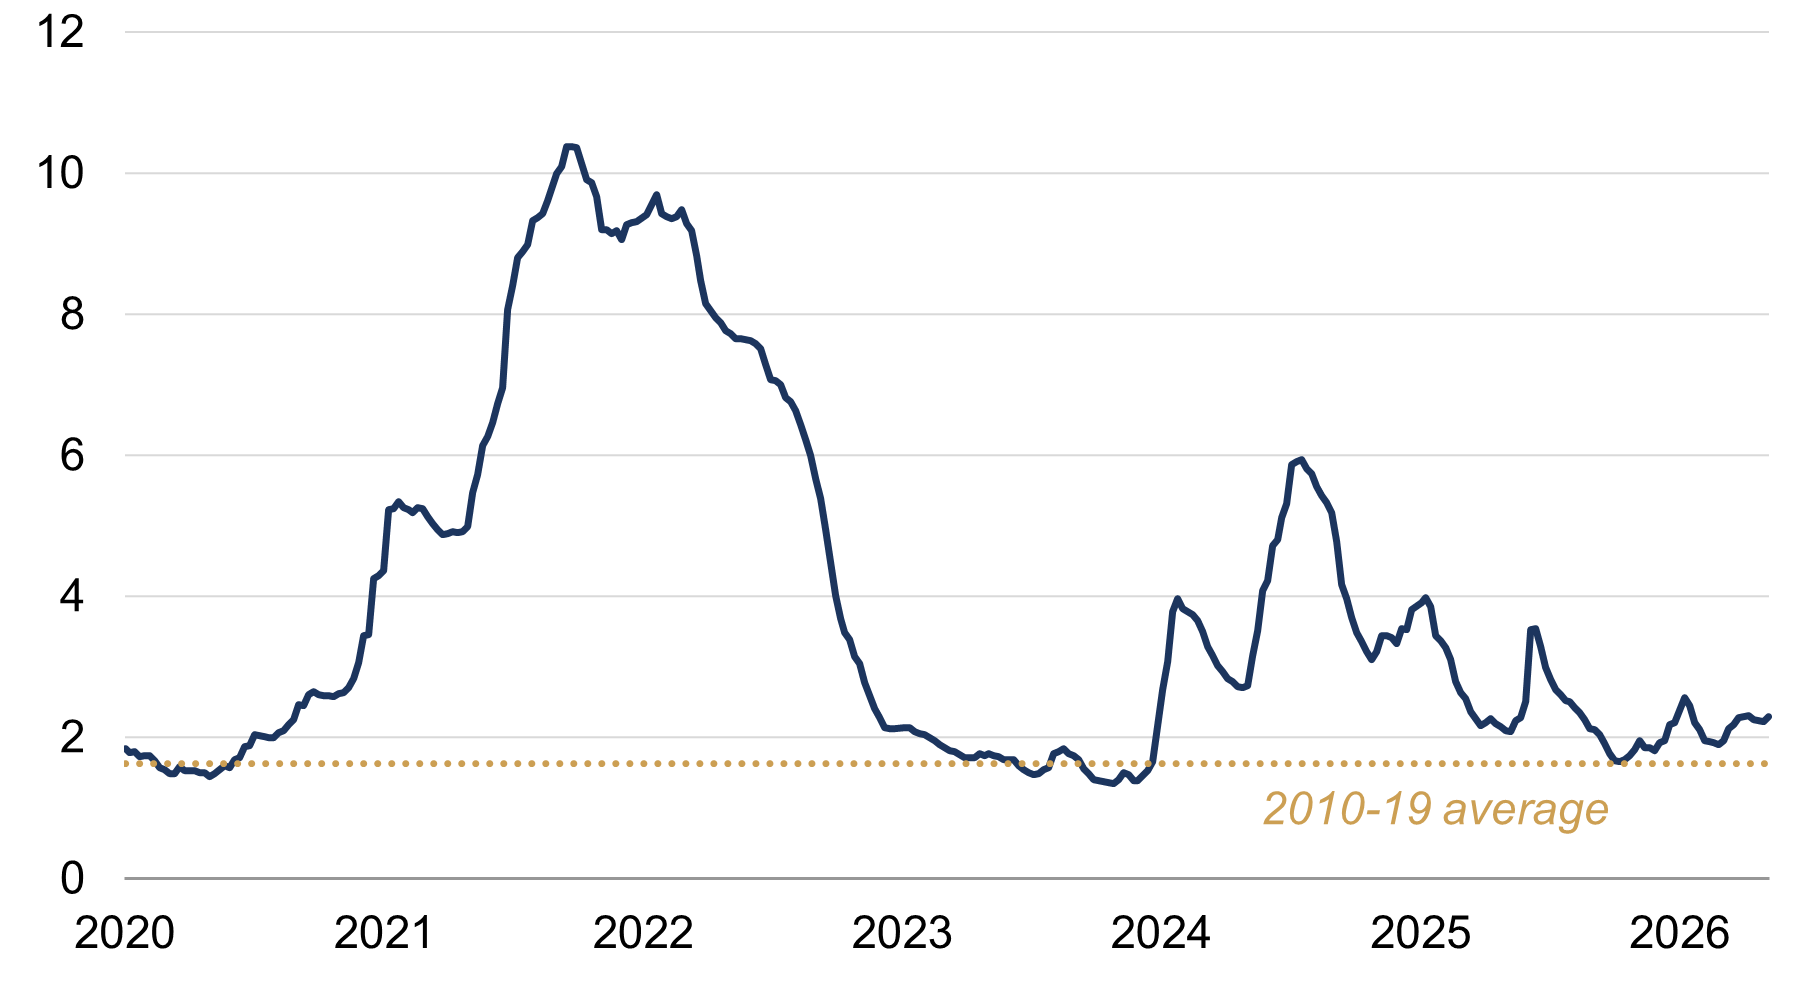
Source: Rothschild & Co, Bloomberg, Drewry. Note: Weekly data as of 7 May 2026.
4. Overall, global supply chain stress is building but not yet severe
Another indicator, the Federal Reserve Bank of New York’s Global Supply Chain Pressure Index, measures deviations in global supply chain conditions relative to the ‘norm’, with a higher reading signalling more stress than usual. The model combines a wide range of transport cost data with similar supply-related manufacturing PMI sub-indices, to those mentioned above.
The index jumped from ‘normal’ levels to almost two standard deviations higher in April, having already risen for more routine reasons (figure 4). Yet, while global supply chain conditions appear more stressed on this measure, it remains well below its post-pandemic high. For what it’s worth, this index’s more visible rise likely stems from transport costs – other than spot container rates, which as noted have not risen much yet – given that the other supply-related US ISM manufacturing PMI sub-indices did not change dramatically in April (although, this global index of course uses PMI data from other regions as well).
Figure 4: Global Supply Chain Pressure Index
Standard deviations from long-run average (x)
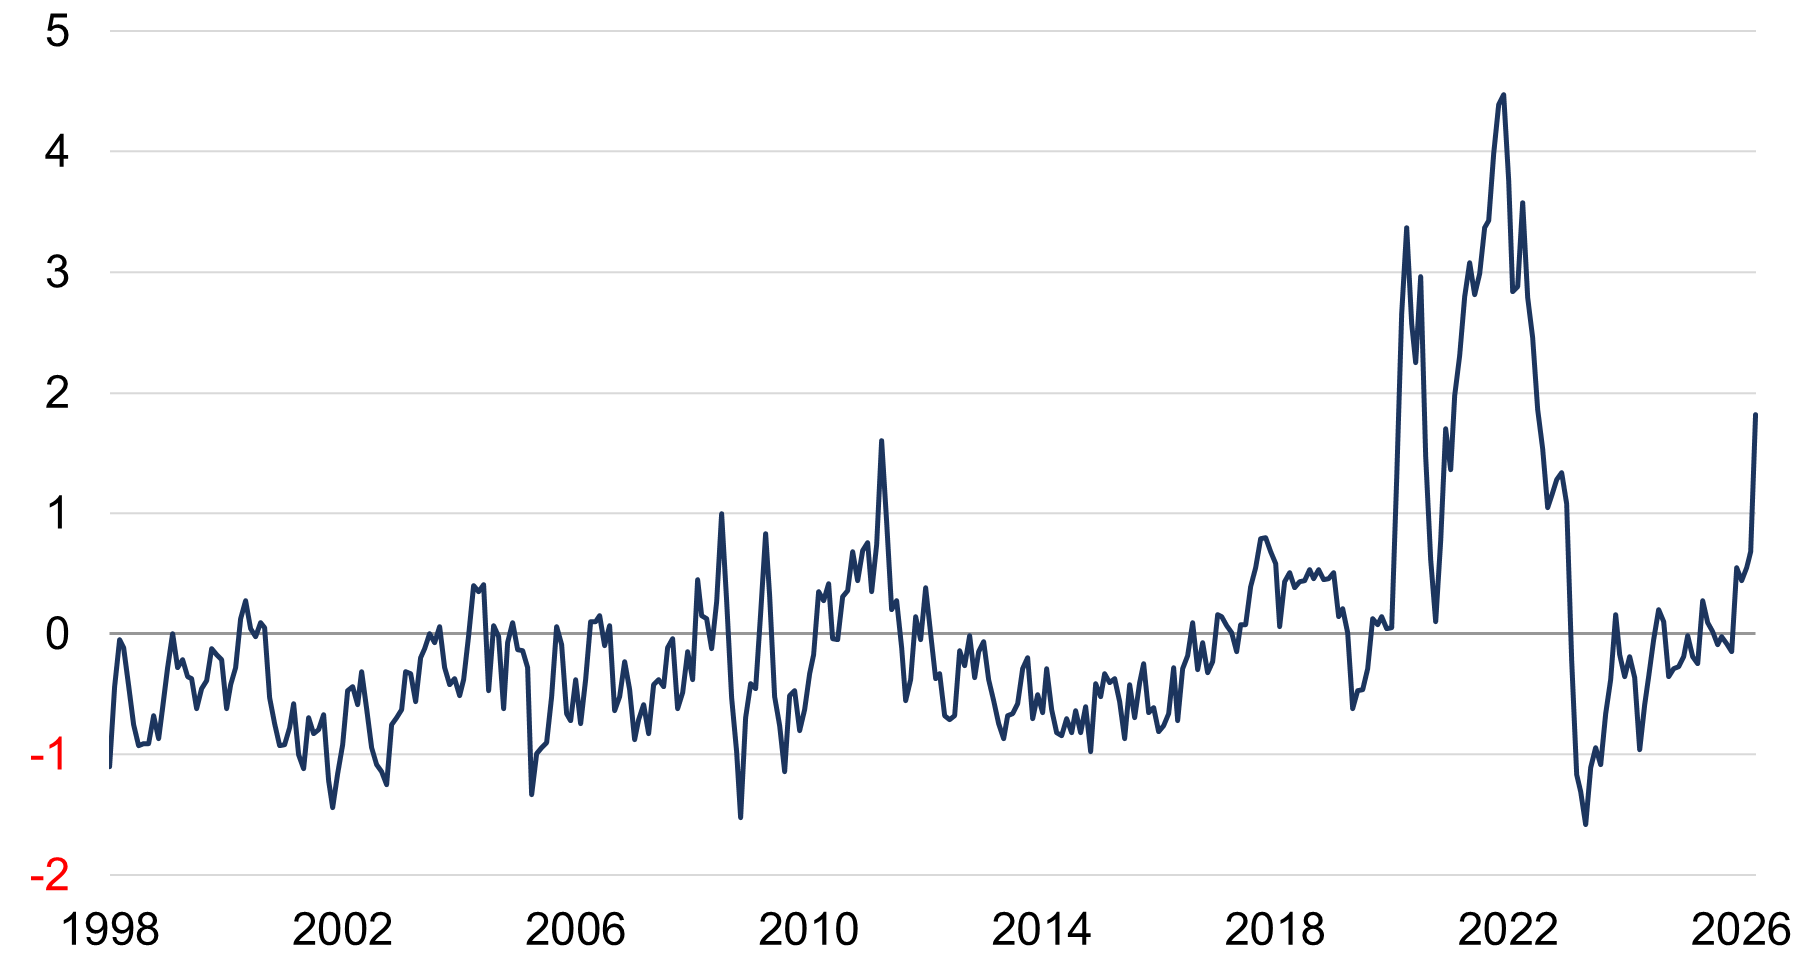
Source: Rothschild & Co, Bloomberg, Federal Reserve Bank of New York. Note: Monthly data as of April 2026.
5. Global goods trade volumes remain healthy for now
World merchandise trade volumes grew at a record pace in the first two months of this year, after already expanding at their strongest pace last year since 2021 (note: the official CPB dataset goes back to 2000).
Gauging the impact since the escalation in Middle East hostilities is trickier given that the CPB releases are not the timeliest. The IMF’s PortWatch platform publishes an experimental dataset using satellite data on maritime trade (which accounts for over four-fifths of global commerce in volume terms). It slowed in March, but remained in positive territory on a year-on-year basis (figure 5), and maritime trade has likely been more visibly disrupted than other forms of transport by the Middle East conflict.
Figure 5: World trade volume growth
Three-month moving average (year-over-year, %)
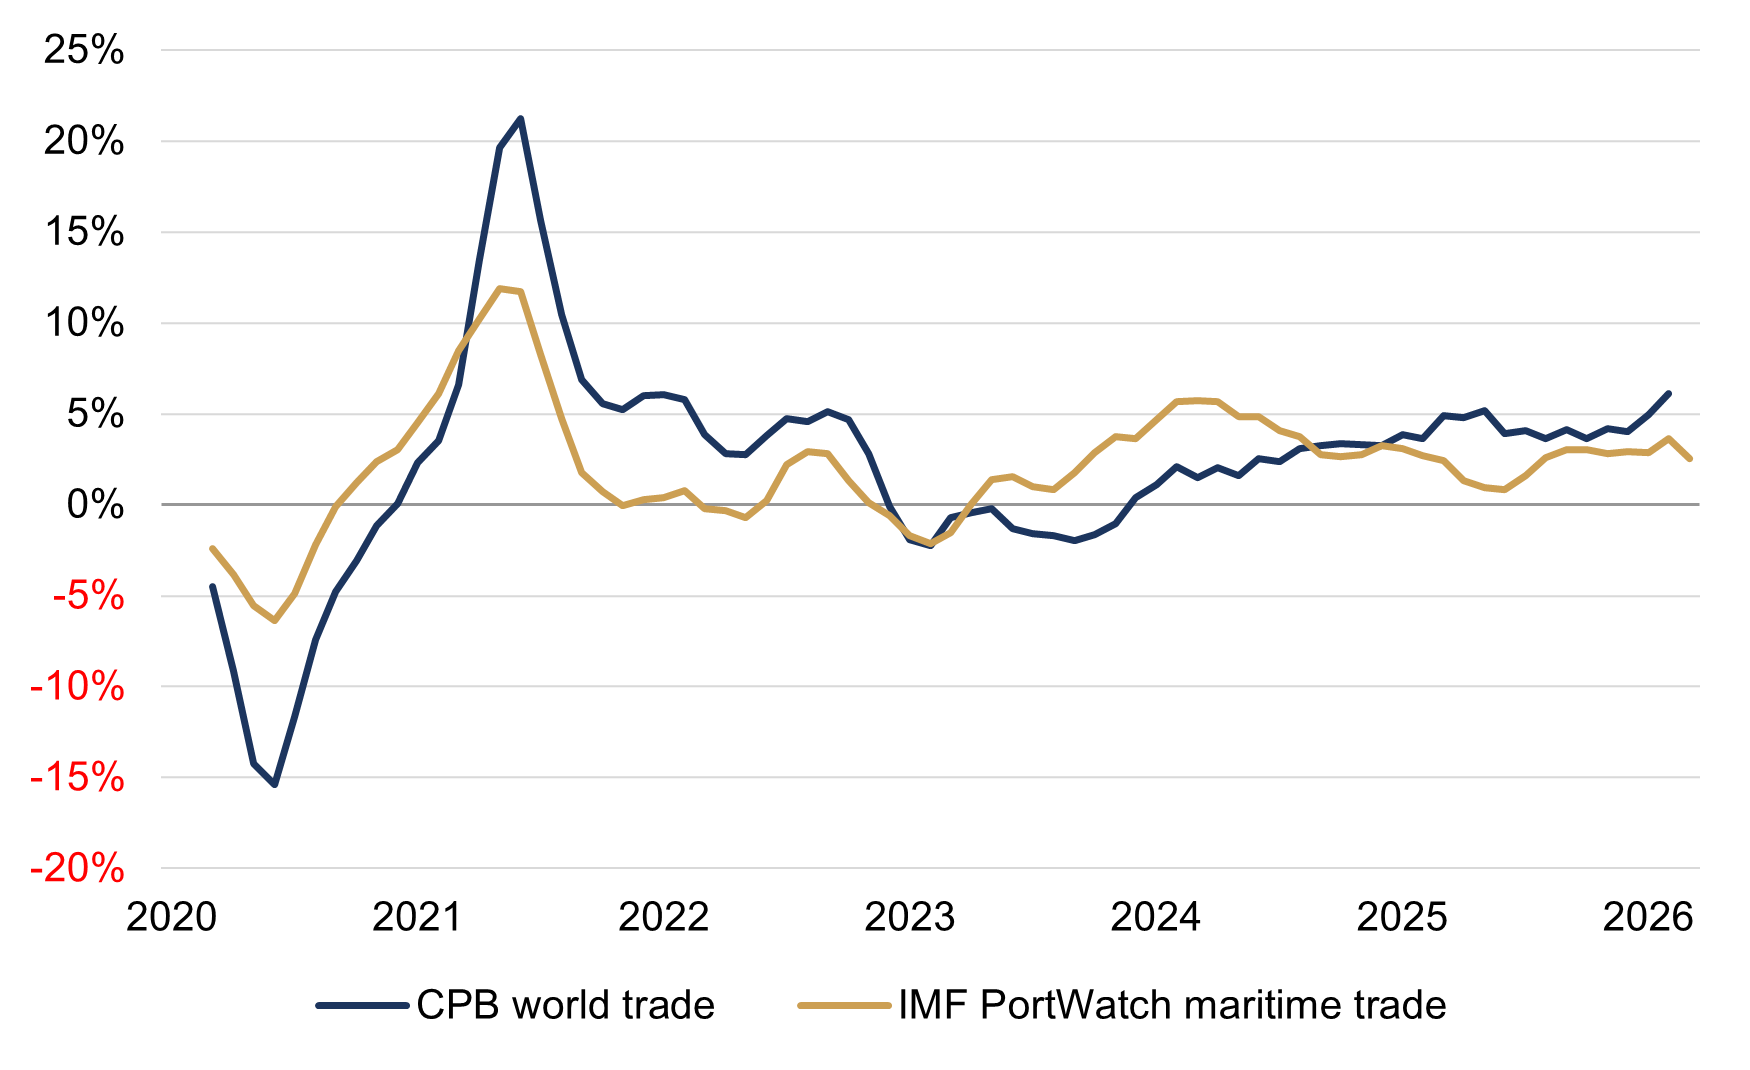
Source: Rothschild & Co, CPB, Arslanalp S., S. M. Choi, P. Kamali, R. Koepke, M. McKetty, M. Ruta, M. Saraiva, A. Sozzi, and J. Verschuur (2025), "Nowcasting Global Trade from Space," IMF Working Paper 25/93. Note: Monthly experimental data as of March 2026.
Looking ahead, the extent of supply chain disruption will of course depend on both the severity and duration of this conflict, but so far at least the world trade system appears to have been somewhat resilient again (after last year’s surge in the US tariff rate to a post-WW2 high). Some disruption is of course inevitable – energy and food trade has been affected most – but the overall hit to world trade looks small in comparison to the post-pandemic trade shock, for example. Back then, it was the global supply chain which shut down, including the central node of the manufacturing network (China), while there was a lot of pent-up demand following the lockdowns.
Ready to begin your journey with us?
Speak to a Client Adviser in the UK or Switzerland
Past performance is not a guide to future performance and nothing in this article constitutes advice. Although the information and data herein are obtained from sources believed to be reliable, no representation or warranty, expressed or implied, is or will be made and, save in the case of fraud, no responsibility or liability is or will be accepted by Rothschild & Co Wealth Management UK Limited as to or in relation to the fairness, accuracy or completeness of this document or the information forming the basis of this document or for any reliance placed on this document by any person whatsoever. In particular, no representation or warranty is given as to the achievement or reasonableness of any future projections, targets, estimates or forecasts contained in this document. Furthermore, all opinions and data used in this document are subject to change without prior notice.
Read more Wealth Management UK articles
-

Chips: Moore spending
Strategy Blog
Despite renewed Middle East tensions and oil price spikes, a bigger market question is whether AI investment momentum can justify soaring capital expenditure. Demand remains strong, but investors are increasingly focused on adoption, monetisation and funding sustainability, raising concerns over future earnings, valuations and capital discipline.
-

Politics on the beach
Strategy Blog
Populism is reshaping politics across the US and Europe, drawing parties away from the traditional centre. Rather than left versus right, voters increasingly divide along establishment versus anti-establishment lines, creating opportunities for populist movements and challenging conventional political assumptions.
-

Monetary policy - behind the curtain
Strategy Blog
Interest rate expectations have shifted markedly in 2026, with markets now anticipating higher rates amid persistent inflation, economic resilience and more hawkish central banks. Despite this, strong AI-driven earnings have supported equities.
-

Stories from the road
Quarterly Letter
Through deep research and direct engagement with businesses, we seek high-quality companies with strong competitive advantages, disciplined capital allocation and the ability to compound wealth over time.
-

Bringing the right advisers together
Insights
Significant wealth brings complex financial and personal decisions. Rothschild & Co helps coordinate trusted advisers, ensuring aligned, objective guidance, long-term planning and access to specialist expertise through a personalised advisory board.
-

Five stock market talking points in 2026
Strategy Blog
Global equities rose despite geopolitical tensions, as markets looked through near-term risks. AI infrastructure spending drove returns and earnings growth, valuations sent mixed signals, and corporate activity remained subdued but showed signs of recovery.