Buoyant earnings expectations

Rarely has there been a starker contrast between the geopolitical maelstrom and the animal spirits that seem to have gripped equity markets since the start of the year. Even after last week’s bout of (short-lived?) volatility, global stocks are up 3% in 2026, and close to all-time highs. Central to such a resilient equity market story is the friendly economic picture, and ongoing corporate profitability. Fourth quarter earnings season is humming along nicely and analysts’ expectations are robust: global estimates are tracking at ~15% for FY 2026 and ~14% for FY 2027, following a very healthy ~10% outturn in 2025.
But with revenue already growing briskly and US margins at all-time highs are such earnings expectations plausible?
US earnings exceptionalism
Last year’s US stock market underperformance had little to do with earnings: US corporate profits continued to play a starring role, delivering a ~14% earnings growth in 2025 (if fourth quarter estimates are correct). By contrast, UK and European earnings stagnated (partly impaired by dollar weakness) for a second year – further widening the big gulf in earnings that has emerged since 2016.
Figure 1: Selected trailing earnings (EPS in USD, indexed)
100 = 31st January 2016
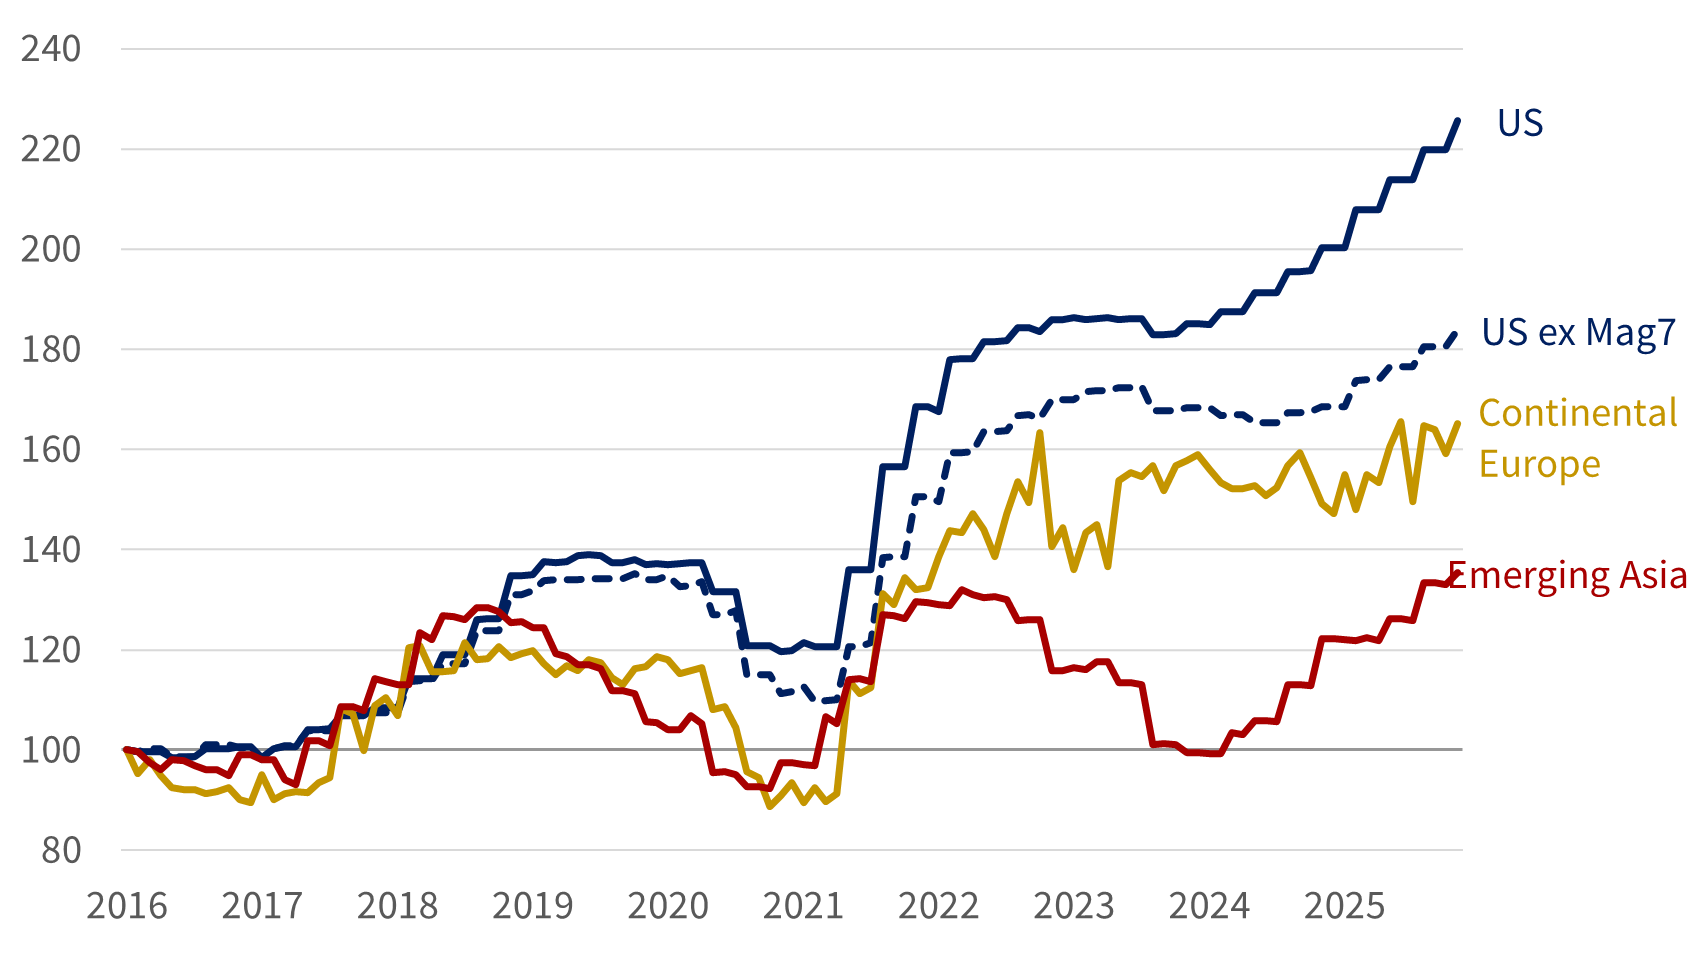
Source: Rothschild & Co, MSCI, Bloomberg. Footnote: ‘Mag7’ refers to Alphabet, Amazon, Apple, Meta, Microsoft, Nvidia and Tesla.
Over the last decade, US companies have compounded their earnings at +9%, against continental Europe +5%, and Asia +3%. As ever, there is a big compositional element to this relative growth story – the former has benefitted from a big tilt towards technology businesses, while Europe and Asia have a bigger bias towards less profitable cyclical sectors, including banks and materials (China’s prolonged profit slump has also been a source of downward pressure on aggregate Asian earnings for much of the period).
Since mid-2018 – when this decoupling of regional earnings began – one third of US earnings growth can be attributed to the large-cap technology cohort, the ‘Magnificent Seven’. In their absence, US earnings look a little more pedestrian – those other 493 stocks’ earnings have grown only slightly faster than their European counterparts’ over that decade-long window.
Can US margins keep expanding?
The biggest component of the US (tech-led) earnings story has been margin expansion, which has been on a one-way trend for much of the past three decades. US margins are currently at ~14%, the highest level seen in the bottom-up data’s history.
Figure 2: S&P500 post-tax (bottom-up) & NIPA pre-tax (whole-economy) margins
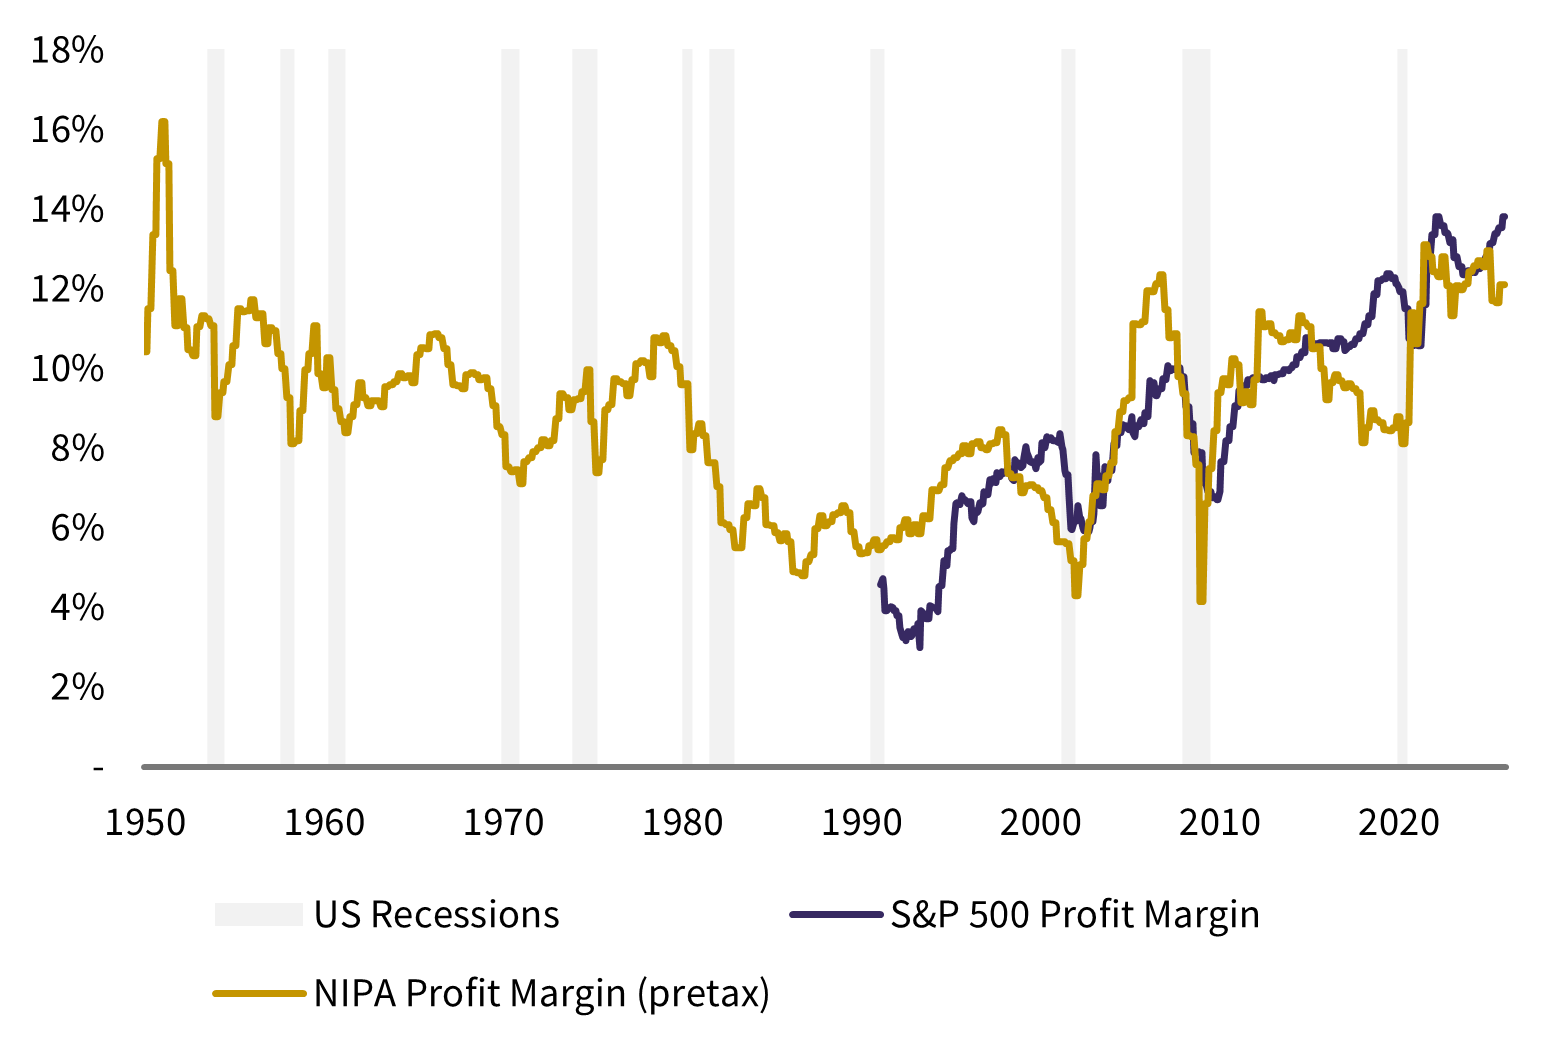
Source: Rothschild & Co, BEA, S&P Global, Bloomberg. Footnote: The NIPA profit measures is taken from the national accounts data (US Bureau of Economic Analysis). They are designed to reflect “income from current production” and to provide consistent coverage over time of all US corporations, including private companies. In contrast, the S&P 500 earnings measures cover the largest public companies and are reported on a GAAP accounting basis.
Again, much of this can be explained by sectoral characteristics: the technology sector is big, easily scalable and employs little capital. But most other US sectors (excluding real estate and healthcare) have seen steadily improving profitability in recent years – a trend assisted by globalisation, declining tax rates and (for much of this period) falling interest rates.
Arguments that margins must fall back to more normal levels, in a big "reversion to the mean”, tend to focus on obvious cyclical headwinds – tariffs and higher interest rates - or even the reversal in some of the big structural drivers, including a shift away from integrated supply chains. But aggregate, national accounts measures (figure 2), for which we have a longer run of data, suggest that today’s pre-tax margins at least may not be so unusual: the mean to which we revert might not be so far below today’s levels.
That said, central to US earnings expectations for 2026 is still more margin expansion, which must be an increasingly high bar. The AI-led tech business model is using more capital and energy, and in the absence of wider AI-related economic gains across other sectors – which is a longer-term possibility, but perhaps not a near-term banker – this may be one source of disappointment ahead.
Broadening earnings growth
Figure 3: DM sector earnings growth
FY 2025 EPS growth
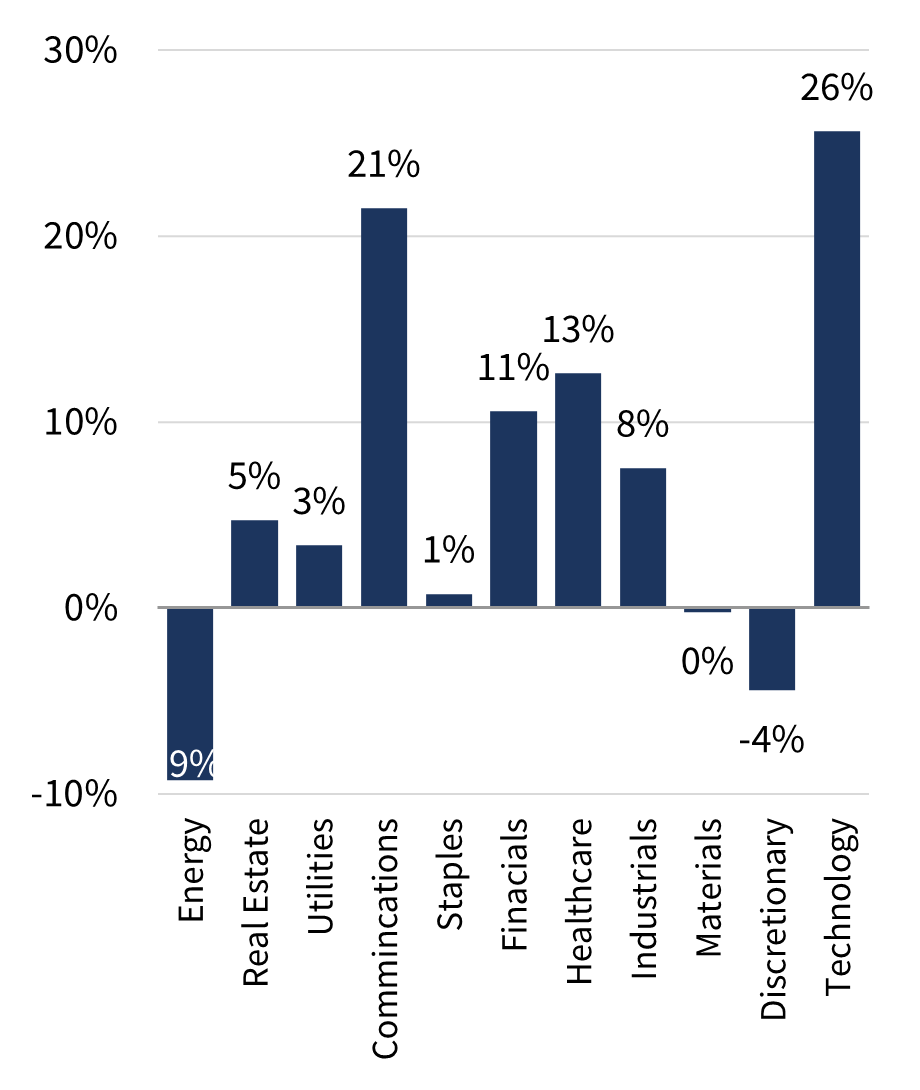
FY 2026 EPS growth
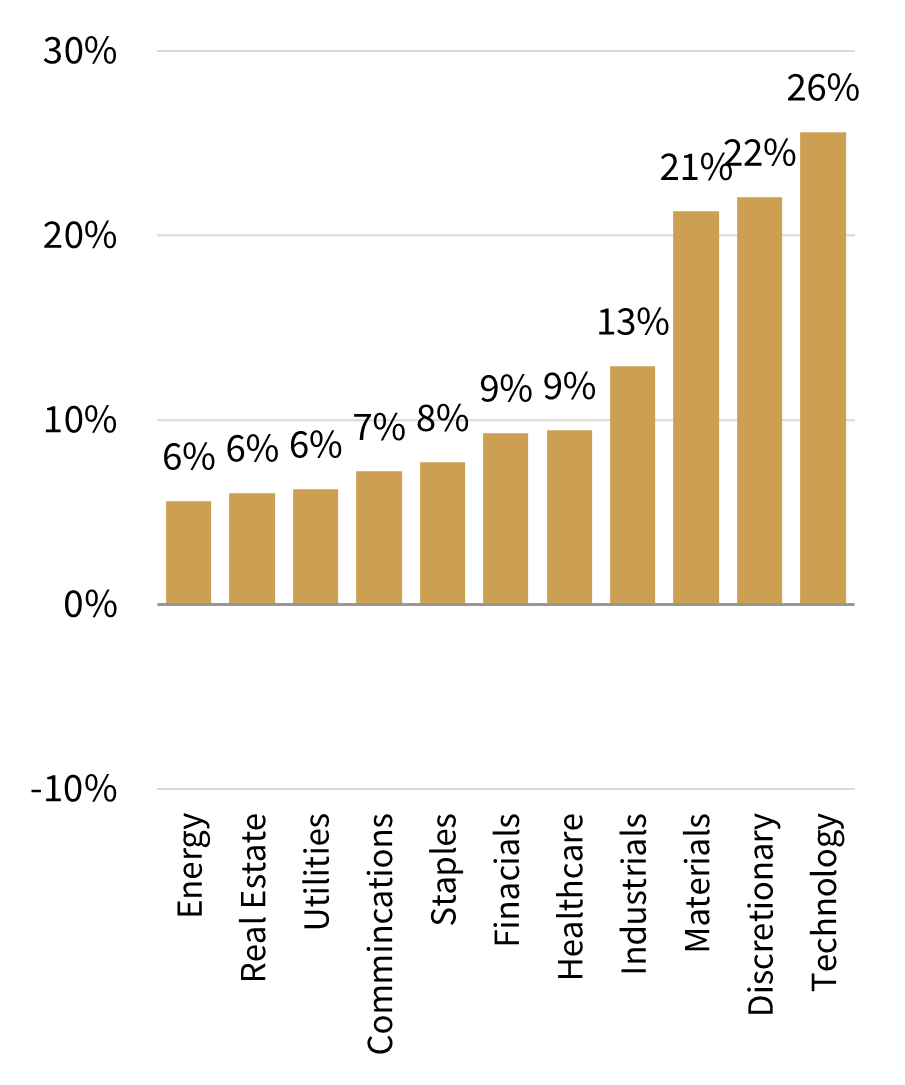
Source: Rothschild & Co, Bloomberg, MSCI
In the circumstances, an ongoing broadening of earnings growth to other sectors and regions – whether AI-related or not – will be a key focus this year. Though technology earnings are still expected to grow most briskly in 2026, growth is becoming more balanced. Even the lacklustre energy sector – where earnings have been contracting for three consecutive years – is poised to return to growth in 2026.
This partly reflects growing expectations of a more reflationary economic environment ahead. Indeed, earnings forecasts for financials, industrial and material sectors continue to build. Financials stand to benefit from reduced US regulation and steeper yield curves, amidst ongoing economic expansion and restrained asset write-offs. Materials benefit from AI-rollout, but also from wider scarcity in the face of rising structural demand key for more routine inputs (industrial metals) and goods. This broadening is reflected across regions, where Europe, UK and emerging Asia are expecting double digit earnings growth in 2026.
Naturally, there are many potential stumbling blocks ahead, but if we continue to see a gradual firming in global economies – percolating through to revenues - then this broadening of earnings growth can continue. In itself this is no guarantee that stock prices will follow suit, but so far at least sentiment seems supportive of a change in market leadership.
Ready to begin your journey with us?
Speak to a Client Adviser in the UK or Switzerland
Past performance is not a guide to future performance and nothing in this article constitutes advice. Although the information and data herein are obtained from sources believed to be reliable, no representation or warranty, expressed or implied, is or will be made and, save in the case of fraud, no responsibility or liability is or will be accepted by Rothschild & Co Wealth Management UK Limited as to or in relation to the fairness, accuracy or completeness of this document or the information forming the basis of this document or for any reliance placed on this document by any person whatsoever. In particular, no representation or warranty is given as to the achievement or reasonableness of any future projections, targets, estimates or forecasts contained in this document. Furthermore, all opinions and data used in this document are subject to change without prior notice.
Read more Wealth Management UK articles
-

Chips: Moore spending
Strategy Blog
Despite renewed Middle East tensions and oil price spikes, a bigger market question is whether AI investment momentum can justify soaring capital expenditure. Demand remains strong, but investors are increasingly focused on adoption, monetisation and funding sustainability, raising concerns over future earnings, valuations and capital discipline.
-

Politics on the beach
Strategy Blog
Populism is reshaping politics across the US and Europe, drawing parties away from the traditional centre. Rather than left versus right, voters increasingly divide along establishment versus anti-establishment lines, creating opportunities for populist movements and challenging conventional political assumptions.
-

Monetary policy - behind the curtain
Strategy Blog
Interest rate expectations have shifted markedly in 2026, with markets now anticipating higher rates amid persistent inflation, economic resilience and more hawkish central banks. Despite this, strong AI-driven earnings have supported equities.
-

Stories from the road
Quarterly Letter
Through deep research and direct engagement with businesses, we seek high-quality companies with strong competitive advantages, disciplined capital allocation and the ability to compound wealth over time.
-

Bringing the right advisers together
Insights
Significant wealth brings complex financial and personal decisions. Rothschild & Co helps coordinate trusted advisers, ensuring aligned, objective guidance, long-term planning and access to specialist expertise through a personalised advisory board.
-

Five stock market talking points in 2026
Strategy Blog
Global equities rose despite geopolitical tensions, as markets looked through near-term risks. AI infrastructure spending drove returns and earnings growth, valuations sent mixed signals, and corporate activity remained subdued but showed signs of recovery.