(Re)emerging market stocks?

Emerging market (EM) stocks have rarely outperformed their developed market (DM) counterparts over the past decade-and-a-half, and when they have, it has usually been by a modest amount. However, the MSCI EM stock index is ahead of the developed market benchmark this year in dollar terms for the first time since 2020 – and by the widest margin since 2017 (figure 1).
Figure 1: EM-DM stock market return gap
MSCI indices (US dollar terms, percentage points)
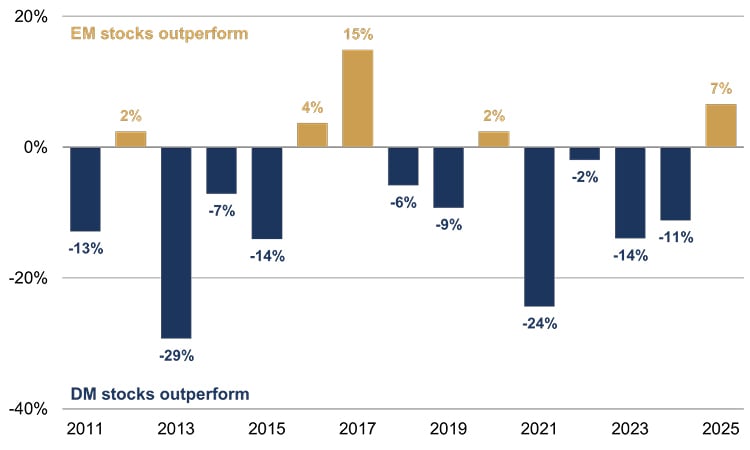
Source: Rothschild & Co, Bloomberg, MSCI
EM stock market gains have been broad-based across the three main regions this year – EM Asia (+18% in dollar terms); Latam (+26%); EM EMEA (+20%) – despite their completely different stock index compositions. For example, EM Asia has a large weighting in growth-style sectors – such as technology – while Latam and EM EMEA have no technology, and much more exposure to commodities (particularly the former). Moreover, local currency returns have still been in double-digit territory in each of the three regions, meaning currency effects – the weaker dollar – have not been the main driver of strong dollar-denominated returns.
Given it has been a while since EM stocks had widespread momentum, we first dust off the history books and share some context on the region, before assessing whether there is substance behind this latest mood shift.
EMs: some context
EM stocks probably received most attention during the 2000s (despite taking off in the prior decade). Notably, the BRIC concept was coined by economist Jim O’Neill in 2001, who suggested that Brazil, Russia, India and China – hence the acronym – would account for a larger share of global GDP (and subsequently investment returns) over time.
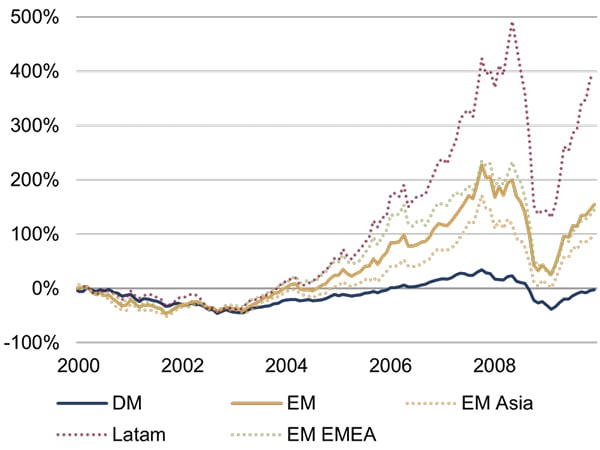
The GDP share of these nations initially rose broadly until around 2010, with EM stock returns outperforming strongly. The MSCI EM index was up by 150% in dollar terms during the noughties – the volatile Latam index was up almost five-fold amid the commodity boom – compared to a flat decade for DM stocks (figure 2). The starting point for the latter was of course the peak of the dot-com bubble in 2000 – at which point the US market was perhaps the most expensive it has ever been – and that decade culminated in the global financial crisis.
|
Figure 2:
Source: Rothschild & Co, Bloomberg, MSCI |
Figure 3:
Source: Rothschild & Co, Bloomberg, MSCI |
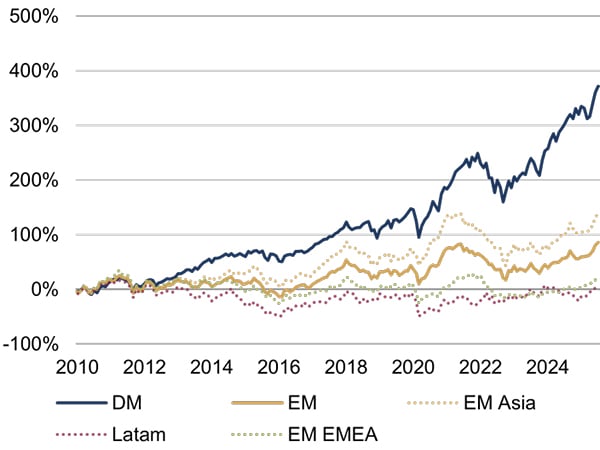
Even so, the BRIC theme has subsequently proven to be a triumph of marketing over substance. Only China’s global GDP share has risen significantly since 2010 (India’s GDP share has risen as well, but only a little), and none of these four stock markets have beaten developed stocks in dollar terms since then. The wider MSCI EM Index has – perhaps unsurprisingly, then – underperformed hugely in common currency terms (figure 3). Most strikingly, a US investor who put their money in the soaring MSCI Latam index at the start of 2010 would still not have broken even yet. (N.B. over the entire 2000-2025 period, the MSCI EM stock index has admittedly edged DM stocks in dollar terms).
Fortunately, we have always felt that Latam and EM EMEA are too illiquid, volatile and risky to be suitable from a wealth preservation investment standpoint – whatever their economies are up to. In Latam, profitability tends to fluctuate greatly, which may be linked to its weaker governance, dependence on the commodity cycle and elevated currency volatility. EM EMEA has larger weightings in rich economies nowadays – such as Saudi Arabia – but other countries in this broad region still exhibit more volatile economic and investment performance. Conversely, EM Asia appears to have learnt from the lessons of the 1997 Asian Financial Crisis. Economies there are relatively stable; inflation is lower; there is less government debt and currency risk; governance is better; the product mix is higher value-add and more diversified; their role in global trade has become more integral.
Have stock fundamentals changed?
Turning to developments this year, it is hard to definitively pinpoint the drivers of broad-based EM outperformance, mostly because of those big compositional differences across the three stock indices. The weaker dollar and declining interest rates may have played a role in explaining the recent ascent – particularly for countries with a lot of dollar-denominated debt. Meanwhile, some of the more ‘developed’ countries within the EM Asia cohort may be benefitting from renewed AI-related stock momentum since Trump’s tariff ‘Liberation Day’.
To assess whether the recent outperformance is more sentiment-driven or something more fundamental, we can look at shifts in trailing (or actual) earnings per share growth across the different stock indices, given that it is the most important driver of stock returns over the long run (figure 4). For context, the earnings profile for developed markets has steadily risen since 2010, whereas the EM one has been rangebound for the past fifteen years – which is perhaps unsurprising given the overall return trends shown in figure 3 (remarkably, Latam and EM EMEA dollar earnings per share are below where they were at the start of 2010).
Figure 4: Trailing earnings per share
MSCI indices, rebased series (100 = January 2010, US dollar terms)
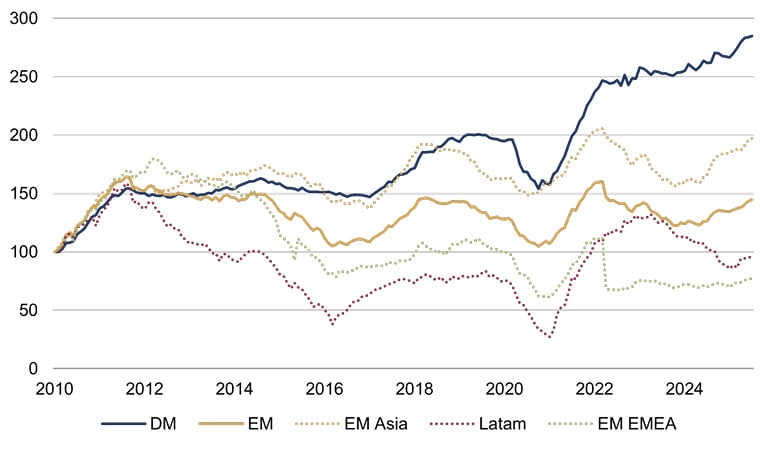
Source: Rothschild & Co, LSEG Datastream, MSCI, I/B/E/S
However, EM trailing earnings have turned higher over the past couple of years, mostly due to EM Asia, but earnings growth has also broadened to Latam and EM EMEA in 2025. Within EM Asia, the earnings uptick has been broad across the four majors – Taiwan, Korea, India and China – though earnings growth has been most notable in Taiwan this year, amid heightened semiconductor demand (TSMC, the world’s most important leading-edge chip producer, accounts for more than half of that index’s total market capitalisation). I/B/E/S forward earnings estimates suggest that EM Asia earnings growth is on track to outpace that of DMs this year – which seems somewhat plausible given this year’s outturns to date – and even modestly next year.
Clearly, then, there is some substance behind this year’s broad-based EM stock rally. From a purely top-down and tactical standpoint, however, we carry no strong torch for any major region currently. We are of course watching those earnings – and tariff – developments closely.
Ready to begin your journey with us?
Speak to a Client Adviser in the UK or Switzerland
Past performance is not a guide to future performance and nothing in this article constitutes advice. Although the information and data herein are obtained from sources believed to be reliable, no representation or warranty, expressed or implied, is or will be made and, save in the case of fraud, no responsibility or liability is or will be accepted by Rothschild & Co Wealth Management UK Limited as to or in relation to the fairness, accuracy or completeness of this document or the information forming the basis of this document or for any reliance placed on this document by any person whatsoever. In particular, no representation or warranty is given as to the achievement or reasonableness of any future projections, targets, estimates or forecasts contained in this document. Furthermore, all opinions and data used in this document are subject to change without prior notice.
Read more Wealth Management UK articles
-

Chips: Moore spending
Strategy Blog
Despite renewed Middle East tensions and oil price spikes, a bigger market question is whether AI investment momentum can justify soaring capital expenditure. Demand remains strong, but investors are increasingly focused on adoption, monetisation and funding sustainability, raising concerns over future earnings, valuations and capital discipline.
-

Politics on the beach
Strategy Blog
Populism is reshaping politics across the US and Europe, drawing parties away from the traditional centre. Rather than left versus right, voters increasingly divide along establishment versus anti-establishment lines, creating opportunities for populist movements and challenging conventional political assumptions.
-

Monetary policy - behind the curtain
Strategy Blog
Interest rate expectations have shifted markedly in 2026, with markets now anticipating higher rates amid persistent inflation, economic resilience and more hawkish central banks. Despite this, strong AI-driven earnings have supported equities.
-

Stories from the road
Quarterly Letter
Through deep research and direct engagement with businesses, we seek high-quality companies with strong competitive advantages, disciplined capital allocation and the ability to compound wealth over time.
-

Bringing the right advisers together
Insights
Significant wealth brings complex financial and personal decisions. Rothschild & Co helps coordinate trusted advisers, ensuring aligned, objective guidance, long-term planning and access to specialist expertise through a personalised advisory board.
-

Five stock market talking points in 2026
Strategy Blog
Global equities rose despite geopolitical tensions, as markets looked through near-term risks. AI infrastructure spending drove returns and earnings growth, valuations sent mixed signals, and corporate activity remained subdued but showed signs of recovery.