Tariffs: Assessing initial manufacturing damage

Talk of recession has moved centre stage following Trump’s tariff announcement on 2 April 2025.
The manufacturing sector will feel the initial pain as tariffs are imposed on goods rather than services, and its inventories make it highly cyclical at the best of times. However, it can be difficult to gauge how the global manufacturing cycle is evolving, as hard (or actual) global industrial production data are only updated with a lag – the latest refer to February, for example.
That said, soft (or survey) data – which correlate somewhat neatly with the hard data – are now capturing developments from April. Market participants, like us, tend to closely watch the Purchasing Managers’ Indices (PMIs) in particular, which are released at the start of each month. Almost 14,000 businesses are surveyed across more than 40 countries, covering 98% of global manufacturing value added. Companies are asked if business conditions have improved, worsened or stayed the same, with a reading of 50 reflecting neutral – or ‘no change’ in – conditions. A reading above (below) 50 subsequently reflects improving (deteriorating) conditions. The PMIs are designed to fluctuate around a constant mean – in practice, a trend rate of growth rather than a specific level of output – which help to identify turning points in the cycle.
Before diving into the PMI observations, it is worth highlighting one caveat: the point in time in which companies were surveyed will have influenced their responses. Trump announced huge tariffs on April 2nd; paused country-specific ones on April 9th; raised tariffs on China to 145%; announced various country-specific carve outs; and suggested new sector-level tariffs. Clearly, business sentiment will have also been volatile during this turbulent month.
At the global level, the manufacturing PMI unsurprisingly weakened in April, though only to 49.8, so just below the ‘neutral’ 50-mark. This reading is not yet consistent with a recession: for context, during the big 21st century setbacks – the pandemic and the global financial crisis – the global manufacturing PMI slumped to 39.6 in April 2020 and a record low of 33.8 in December 2008. However, there were divergences in the country-level data, even within regions (figure 1).
Figure 1: Manufacturing PMI heatmap
Diffusion indices (50 = ‘no change’)
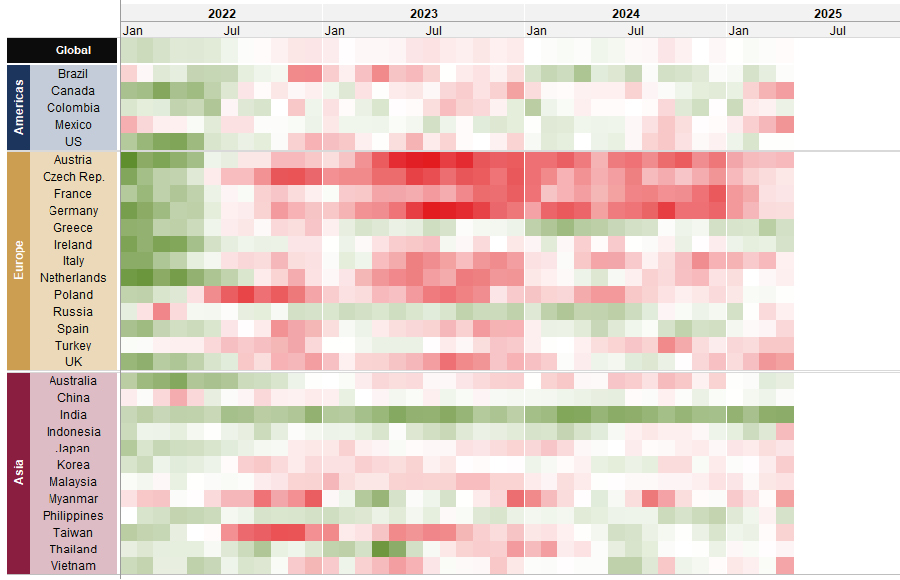
Source: Rothschild & Co, Bloomberg, S&P Global Note: The manufacturing PMI ranges from 0 to 100, with a reading of 50 indicating 'no change'. A (green) reading above 50 is expansionary, while a (red) reading below 50 is contractionary. The further away from 50 the greater the change.
In Asia, the April manufacturing PMIs were mixed following ‘Liberation Day’. India’s manufacturing businesses remained buoyant: a potential trade deal is in the works, and it could stand to benefit from shifting production as the most punitive tariffs are currently on China. However, the latter’s manufacturing PMI did not fall meaningfully, even amid a tit-for-tat tariff escalation with the US, perhaps because authorities there have committed to greater policy support. Elsewhere, sentiment deteriorated in the lower value-added manufacturing hubs (Vietnam; Indonesia; Myanmar) and the major semiconductor producers (Taiwan; Korea), as these nations were initially imposed with lofty ‘reciprocal’ tariffs – presumably to deter them acting as an entrepôt for Chinese exports on route to the US.
In Europe, the eurozone manufacturing PMI remarkably edged higher in April, though at still-subdued levels, signalling perhaps that tariffs are not the sole driver of the manufacturing economy. Local fiscal and monetary policy developments may have helped: Germany announced a huge infrastructure package, the wider EU bloc is ramping up defence spending, and the European Central Bank’s deposit rate has now almost halved from its peak. A ceasefire in Ukraine – far from a done deal of course – may further lower energy prices and input costs for European manufacturers. Bucking the regional trend, the UK manufacturing PMI remained notably weak, though this coincided with Autumn Budget announcements taking effect in April, including a rise in the national minimum wage and employers’ National Insurance contributions.
Surprisingly, the US manufacturing PMI was stable in April, but data there have been particularly difficult to read: some retailers were stockpiling ahead of those likely tariffs, which may have distorted usual manufacturing shipment patterns. Meanwhile, business sentiment declined further in countries immediately targeted by the new administration at the turn of the year, including Canada and Mexico.
Overall, these business surveys suggest that global manufacturing is in a worse position than prior to ‘Liberation Day’, but are not yet indicating a significant manufacturing downturn. As we’ve highlighted before, manufacturing’s share of global GDP has diminished over time anyway, with the service sector now accounting for more than 60% of world GDP according to the World Bank (roughly 75% for US GDP). The global Composite PMI, which combines both sectors, remained expansionary (or above 50) in April, though below its long-term average, likely suggesting below-trend GDP growth (figure 2).
Figure 2: Global manufacturing and services PMIs
Diffusion indices (50 = ‘no change’)
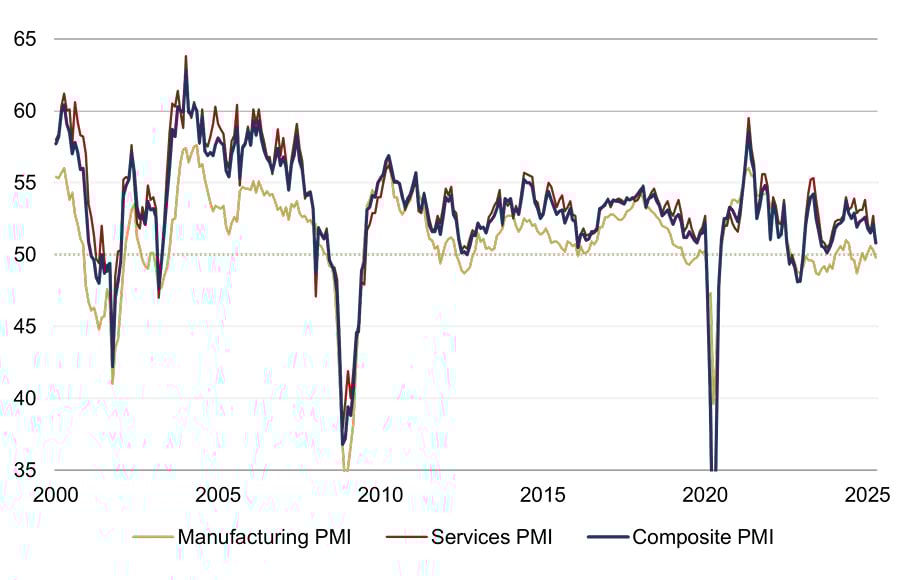
Source: Rothschild & Co, Bloomberg, S&P Global, JP Morgan, Absolute Strategy Resarch
Ready to begin your journey with us?
Speak to a Client Adviser in the UK or Switzerland
Past performance is not a guide to future performance and nothing in this article constitutes advice. Although the information and data herein are obtained from sources believed to be reliable, no representation or warranty, expressed or implied, is or will be made and, save in the case of fraud, no responsibility or liability is or will be accepted by Rothschild & Co Wealth Management UK Limited as to or in relation to the fairness, accuracy or completeness of this document or the information forming the basis of this document or for any reliance placed on this document by any person whatsoever. In particular, no representation or warranty is given as to the achievement or reasonableness of any future projections, targets, estimates or forecasts contained in this document. Furthermore, all opinions and data used in this document are subject to change without prior notice.
Read more Wealth Management UK articles
-
Chips: Moore spending
Strategy Blog
Despite renewed Middle East tensions and oil price spikes, a bigger market question is whether AI investment momentum can justify soaring capital expenditure. Demand remains strong, but investors are increasingly focused on adoption, monetisation and funding sustainability, raising concerns over future earnings, valuations and capital discipline.
-
Politics on the beach
Strategy Blog
Populism is reshaping politics across the US and Europe, drawing parties away from the traditional centre. Rather than left versus right, voters increasingly divide along establishment versus anti-establishment lines, creating opportunities for populist movements and challenging conventional political assumptions.
-

Monetary policy - behind the curtain
Strategy Blog
Interest rate expectations have shifted markedly in 2026, with markets now anticipating higher rates amid persistent inflation, economic resilience and more hawkish central banks. Despite this, strong AI-driven earnings have supported equities.
-

Stories from the road
Quarterly Letter
Through deep research and direct engagement with businesses, we seek high-quality companies with strong competitive advantages, disciplined capital allocation and the ability to compound wealth over time.
-
Bringing the right advisers together
Insights
Significant wealth brings complex financial and personal decisions. Rothschild & Co helps coordinate trusted advisers, ensuring aligned, objective guidance, long-term planning and access to specialist expertise through a personalised advisory board.
-

Five stock market talking points in 2026
Strategy Blog
Global equities rose despite geopolitical tensions, as markets looked through near-term risks. AI infrastructure spending drove returns and earnings growth, valuations sent mixed signals, and corporate activity remained subdued but showed signs of recovery.