The US consumer: living with Trump

Donald Trump: “There’ll be a little disturbance, but we’re okay with that.”
Speech to a joint session of Congress, 4th March 2025
In recent weeks, President Trump’s market-unfriendly policies have moved into focus, notably tariffs and cuts to Federal spending. While we should not always take his stated plans at face value, the world’s most important economy surely faces more policy uncertainty than usual.
This seems to have dampened the US consumer’s mood. The Michigan Consumer Sentiment survey – a closely-watched national survey (despite its name) – fell to its lowest reading since 2022 after a modest post-election bounce (figure 1). Unsurprisingly, these surveys can be influenced by political affiliation, but even Republican respondents’ confidence has turned lower.
Figure 1: Michigan Consumer Sentiment
Index
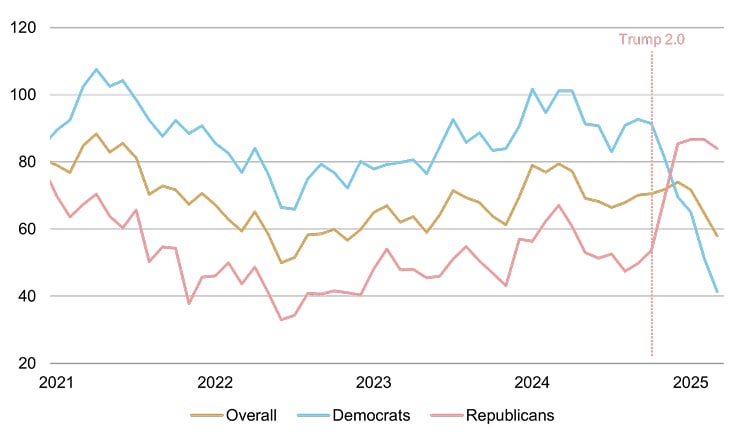
Source: Rothschild & Co, Bloomberg, University of Michigan
The US consumer accounts for around two-thirds of domestic GDP and is of course Global Inc’s number one customer. And so, if this gloom translates to a slowdown in actual spending, it would almost certainly be bad news for the US economy (and likely globally-oriented investment portfolios).
So, does lower consumer confidence necessarily mean weaker spending ahead? And more broadly, what is the state of play for the US consumer amid recent talk of recession?
‘Unhappy’ consumers have been spending
The first of these two questions is perhaps simpler to address. The level of US consumer spending has trended higher over the past year, even as consumer confidence has moved in the opposite direction. Taking this one step further, the correlation between the rate of change in confidence and spending has not been constant over time. Clearly, other factors also matter for spending (figure 2).
Figure 2: US consumer confidence and spending correlation
One-year rolling correlation (monthly changes)
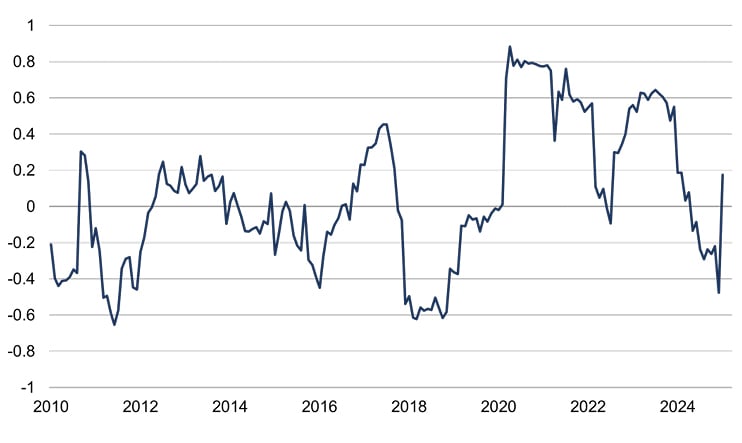
Source: Rothschild & Co, Bloomberg, US Bureau of Economic Analysis, University of Michigan
This does not mean that there are no occasional linkages between sentiment and spending. The latter contracted by 0.5% in January – its weakest reading in almost four years – as confidence also fell. However, this may not have been a causal link: rather than signalling a looming change in the spending trend, the setback in spending was most likely due to unusual weather events, including wildfires in California and cold snaps in other US states. And indeed, the timelier ‘control retail sales’ data – a subset of the official spending data – rebounded in February, suggesting that pullback may have been temporary.
Trump threats: Tariffs and DOGE
As noted, there are clearly other factors that may affect overall spending: changes in jobs, wages, interest rates, wealth and the availability of credit may all play a role (among other things). It helps to group these drivers into: (1) variables that influence the proportion of income which is spent (or not: we usually talk of the savings rate); and (2) variables which affect spendable, or disposable, income itself.
For example, over the past year, the latter category has likely been the bigger driver of consumer spending: positive real (or inflation-adjusted) wage growth rates and a healthy jobs market have boosted disposable incomes, while the household savings rate has only drifted modestly lower. But how might Trump’s policies affect these categories – and subsequently consumption?
Tariffs could hit incomes through higher goods prices, but that cost is also likely to be shared across the exporter, importer and final customer, meaning a limited pass-through to the consumer. Moreover, imports are a small portion of spending in the relatively closed US economy to begin with, some tariffed goods may be substituted for, and the Trump administration have hinted (several times) that ‘deals’ can be struck to reverse them. So, if the overall US effective tariff rate increased by around 10 percentage points – arguably a conservative estimate – and we assume cost is shared equally across all parties, then the hit to incomes may only be 0.5%1.
Meanwhile, there are few signs of cracks forming in the US labour market: unemployment is still low and jobs growth has remained intact this year. This is perhaps surprising: Elon Musk’s controversial Department of Government Efficiency (DOGE) is after all planning big cuts to Federal spending (and subsequently Federal government jobs). In practice, though, their efforts are unlikely to materially boost unemployment: federal government jobs only account for 2% of the total workforce, and there are legal and logistical obstacles to firing government employees anyway.
Still, uncertainty around these two policies could affect the proportion of income which is spent – i.e., push the household savings rate higher – amid falling confidence and negative wealth effects (the US stock market has declined over the past month partly due to this uncertainty). But if disposable income continues to grow, even after tariffs, a significant hit to consumer spending from these variables may be unlikely.
Interest rate risk also abating?
Elevated interest rates are arguably the biggest ‘non-Trump’ risk to consumer spending. Higher interest costs can hit the disposable income channel through households’ exposure to big loans, such as mortgages, autos and credit cards. As noted in a previous update (see here), disposable incomes have been relatively shielded from higher rates as most are locked into 30-year fixed rate mortgages, which account for the lion’s share of their liabilities.
Lower-income households have admittedly felt more pain given their relatively greater exposure to auto and credit card debt, which tend to be shorter duration and more variable. But they account for little in terms of total consumption expenditures: the bottom-quintile income group accounted for less than a tenth of household spending in 2023, compared to almost a 40% contribution from the top-quintile income group.
And in recent months, of course, US interest rates have been falling which may provide some relief for those lower-income groups. This is not yet reflected in household debt service ratios – interest payments as a proportion of disposable incomes – but the latest data relates only to the third quarter of last year, which is when the Federal Reserve began its easing cycle (figure 3). Strikingly, despite the surge in interest rates, the average household is still paying less interest relative to total income compared to the pre-pandemic period.
Figure 3: US household debt service ratio
Total (%)
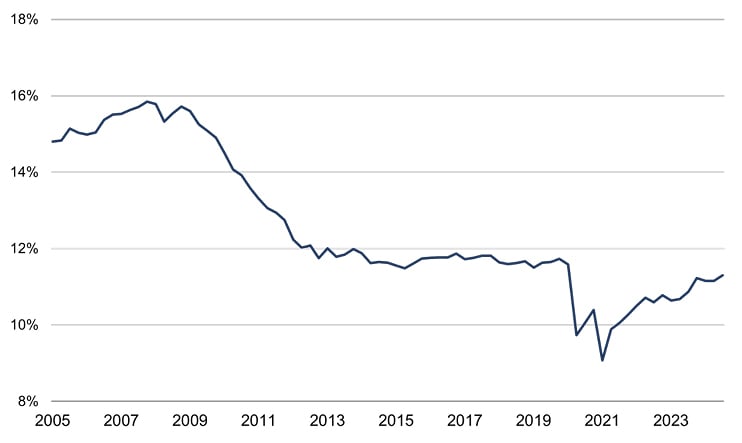
Source: Rothschild & Co, Federal Reserve
What’s more, a decline in interest rates could lower the household savings rate – if it helps support capital markets and consumer wealth, and deters people from saving to begin with – supporting consumption. Credit availability may improve (the direction of travel in recent US bank lending survey responses are tentatively signalling this).
Conclusion:
We think it is still too soon to write off the US consumer. Some of Trump’s policies may affect consumer confidence, but that is not the only driver of overall spending (and indeed, some other policies may be more directly supportive compared to what might otherwise have been the case – such as the prospect of extended tax cuts). Meanwhile, the hit to disposable incomes from tariffs and DOGE-related cuts may not necessarily be that severe – and if falling sentiment causes a fall in Trump’s approval ratings, then those unpopular proposals could be tempered. Interest rates have also begun their descent, albeit gradually, which may soon provide relief to highly-borrowed US households in particular.
Ready to begin your journey with us?
Speak to a Client Adviser in the UK or Switzerland
Citations
[1] A 10% duty on roughly $3.3 trillion goods imports would account for around 1.5% of total disposable income (using 2024 figures). If that cost is split equally between exporters, importers and consumers, then that equates to 0.5%.
Past performance is not a guide to future performance and nothing in this article constitutes advice. Although the information and data herein are obtained from sources believed to be reliable, no representation or warranty, expressed or implied, is or will be made and, save in the case of fraud, no responsibility or liability is or will be accepted by Rothschild & Co Wealth Management UK Limited as to or in relation to the fairness, accuracy or completeness of this document or the information forming the basis of this document or for any reliance placed on this document by any person whatsoever. In particular, no representation or warranty is given as to the achievement or reasonableness of any future projections, targets, estimates or forecasts contained in this document. Furthermore, all opinions and data used in this document are subject to change without prior notice.
Read more Wealth Management UK articles
-

Chips: Moore spending
Strategy Blog
Despite renewed Middle East tensions and oil price spikes, a bigger market question is whether AI investment momentum can justify soaring capital expenditure. Demand remains strong, but investors are increasingly focused on adoption, monetisation and funding sustainability, raising concerns over future earnings, valuations and capital discipline.
-

Politics on the beach
Strategy Blog
Populism is reshaping politics across the US and Europe, drawing parties away from the traditional centre. Rather than left versus right, voters increasingly divide along establishment versus anti-establishment lines, creating opportunities for populist movements and challenging conventional political assumptions.
-

Monetary policy - behind the curtain
Strategy Blog
Interest rate expectations have shifted markedly in 2026, with markets now anticipating higher rates amid persistent inflation, economic resilience and more hawkish central banks. Despite this, strong AI-driven earnings have supported equities.
-

Stories from the road
Quarterly Letter
Through deep research and direct engagement with businesses, we seek high-quality companies with strong competitive advantages, disciplined capital allocation and the ability to compound wealth over time.
-

Bringing the right advisers together
Insights
Significant wealth brings complex financial and personal decisions. Rothschild & Co helps coordinate trusted advisers, ensuring aligned, objective guidance, long-term planning and access to specialist expertise through a personalised advisory board.
-

Five stock market talking points in 2026
Strategy Blog
Global equities rose despite geopolitical tensions, as markets looked through near-term risks. AI infrastructure spending drove returns and earnings growth, valuations sent mixed signals, and corporate activity remained subdued but showed signs of recovery.