Wide valuations, narrow leadership

The ‘Trump Trade’ – driven by the new administration’s promise of lower taxes and deregulation – is in full swing, against a backdrop of resilient (robust?) growth, mild inflation and falling interest rates. US stocks are up over a fifth in 2024 – on track for another year of double-digit returns.
Is some complacency creeping in? Market breadth has narrowed once again and valuations are not just full, but arguably expensive. The cyclically-adjusted price-to-earnings (CAPE) ratio – our preferred valuation measure for stocks - looks pretty dear at almost one-and-a-half standard deviations above its trend.
How much further can this go?
Global stock valuations: CAPE ratio (x)
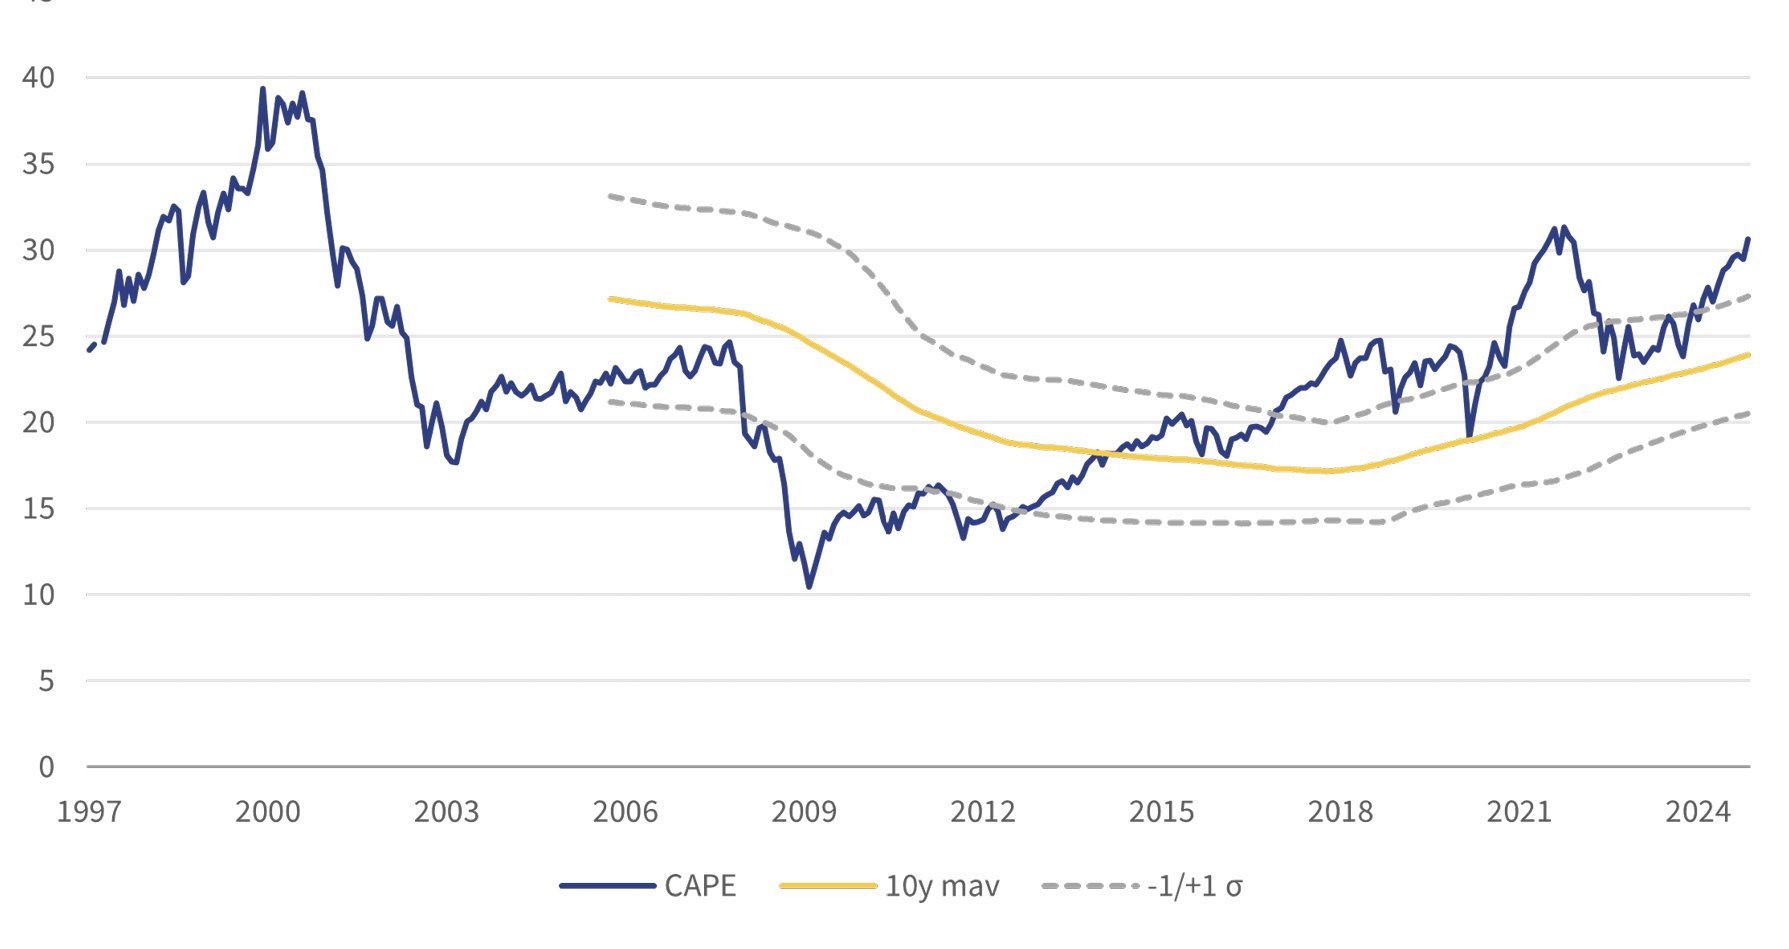
Source: Rothschild & Co, Bloomberg, MSCI
US: exceptional valuations
Spoiler alert: stock market leadership has been narrow. This is neither new nor surprising. The dominance of the US and its big technology companies is not confined to 2024: over the past five years, US stocks have nearly doubled (on a total return basis), while non-US stocks have merely grown by a third (in dollar terms). The divergence hasn’t come from earnings or dividends – which have grown (collectively) by similar rates over this period – but from valuations. US stocks have gotten a lot more expensive, while most other markets - including Europe and the UK - have seen their valuations fall (or 'de-rate').
Decomposed stock market returns (annualised, %)
1st January 2020 to 11th November 2024
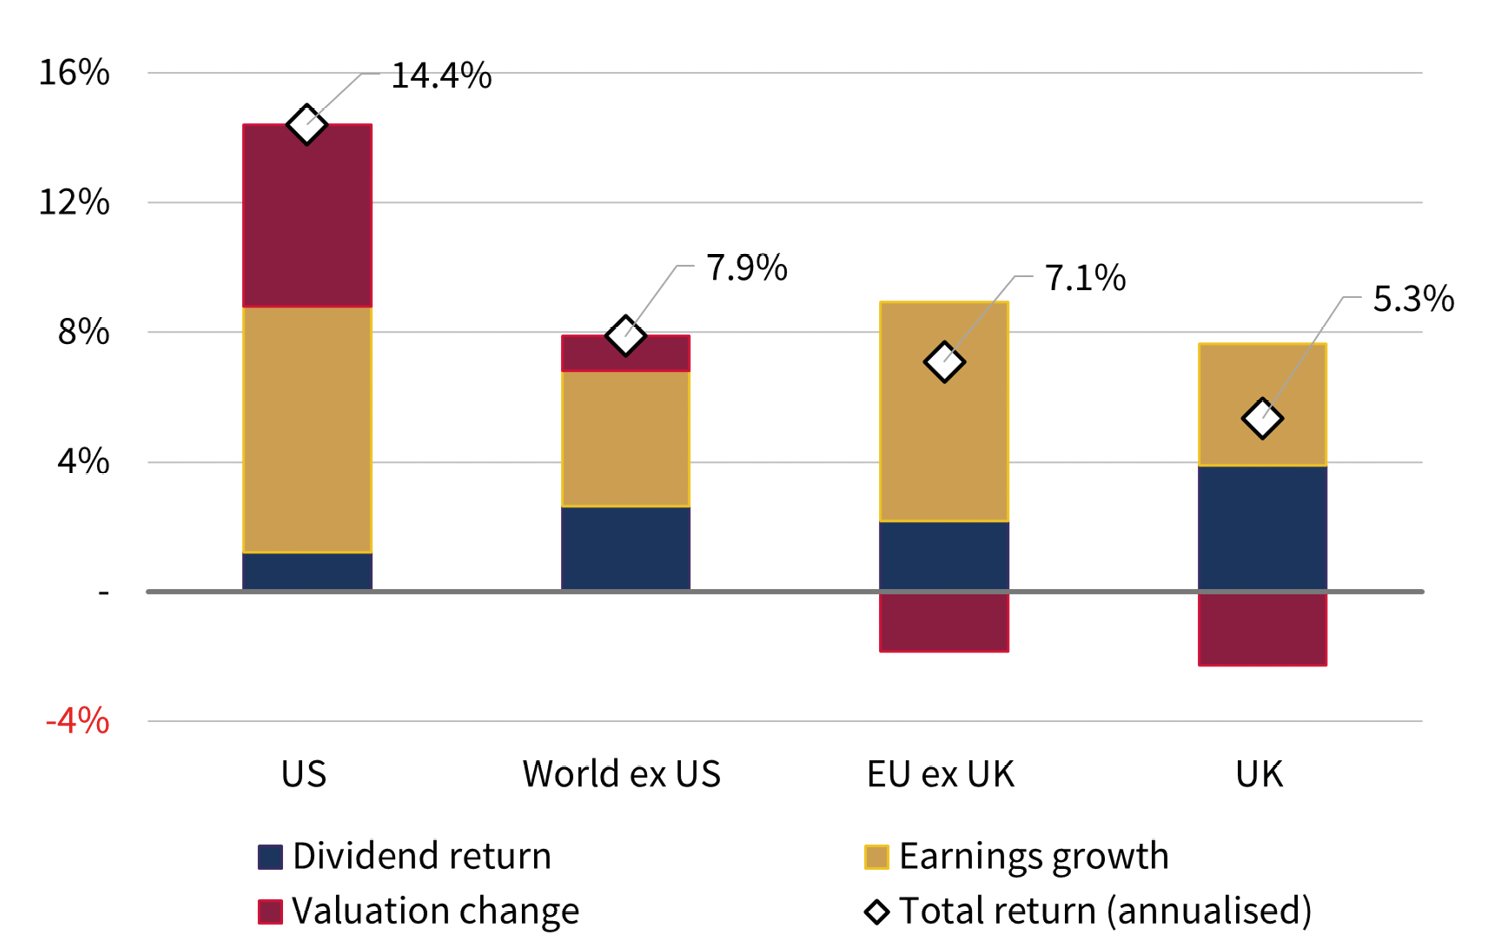
Source: Rothschild & Co, Bloomberg, MSCI
As a result, the usual valuation gap between the US and its developed peers has been unusually wide of late. On the basis of single-year forward PE ratios the US is nearly twice as expensive as the UK, and three fifths more so than Europe, for example. Our CAPE ratio shows the US market to be at its 98th percentile going back over a century - a lofty 36x (equivalent to two standard deviations above its long-term trend). This is more than double the overall valuation of non-US stocks (17.5x).
The truth is that we have only been at these levels twice before: in 2021 and the late ‘90s. At the current valuation (36x), the forward 10-year ‘real’ return for the S&P 500 was negative most of the time:
US stock market valuations and ‘real’ forward returns
January 1900 to October 2014
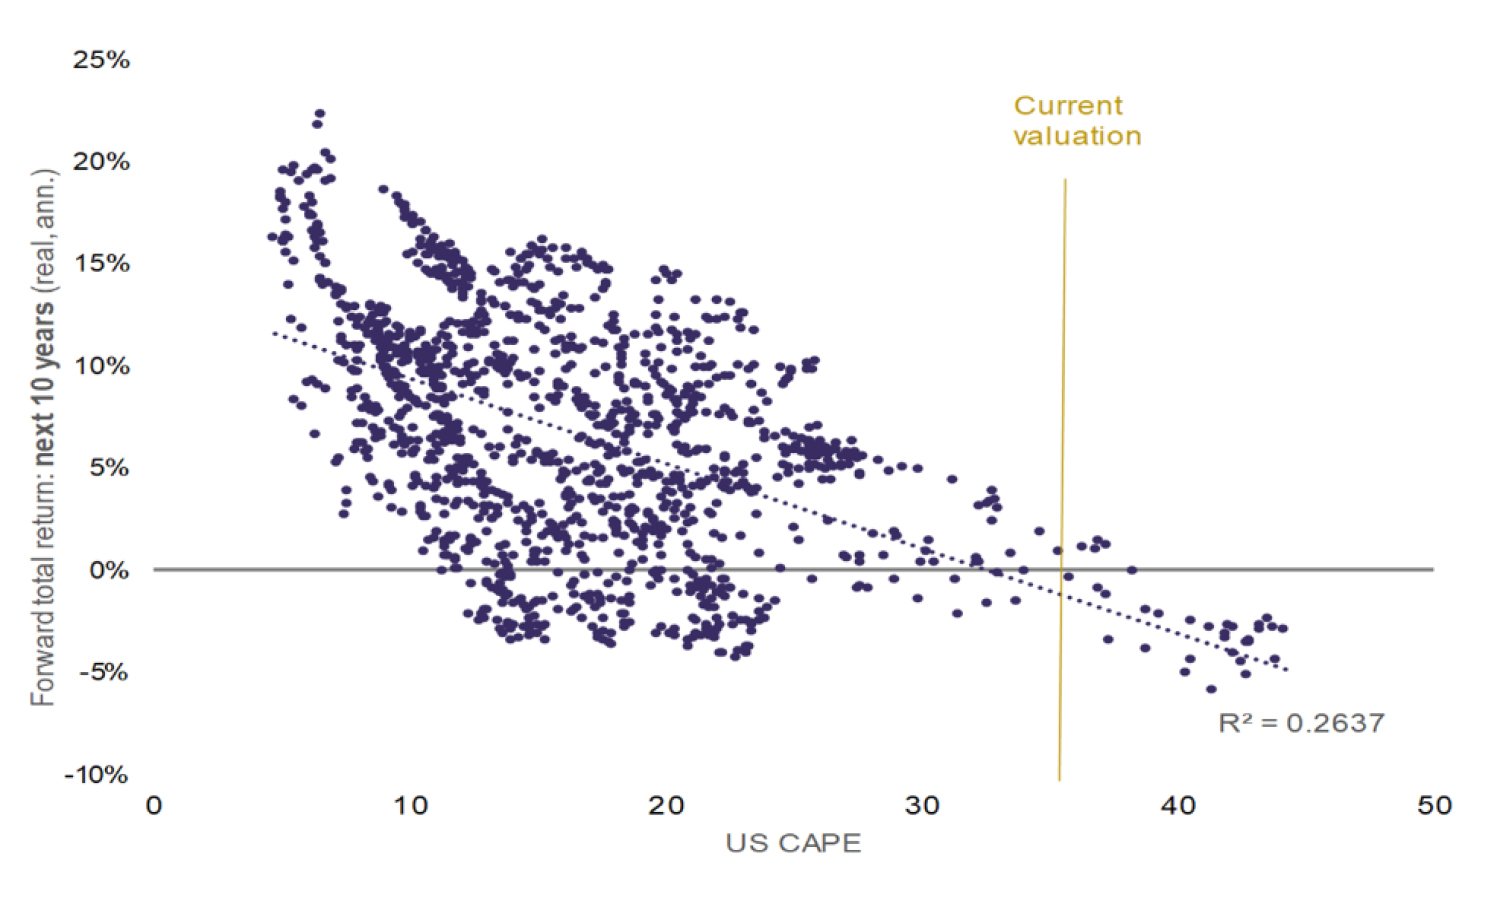
Source: Rothschild & Co, Bloomberg, Shiller
Before we move to panic stations, we need to keep this in perspective. The sample set here is very small and valuations are still well short of the extremes witnessed during the 'dotcom bubble', when prices were truly disconnected from fundamentals. Valuations would need to rise another quarter from here to eclipse that bout of headiness.
However, the resemblance to 2021 is perhaps more unsettling - not only in terms of valuations but also the lopsided, top-heavy US market. In 2021, the largest five US stocks represented nearly a quarter of the S&P 500 index and accounted for more than half of the market’s return. Today the figures are closer to 30% and one third, respectively. Back then only Apple’s market capitalisation exceeded the Russell 2000’s – today, two (nearly three) companies exceed it, with NVDIA’s meteoric rise and contribution most visible. One notable difference: back then interest rates were significantly lower.
What followed in 2022 was a sobering and painful experience. Of course, other things happened that year that likely triggered that particular setback - as we’ve noted before, valuations themselves are rarely the cause of a market reversal. Yet despite their shortcoming as a market timing tool, valuations can be a reasonably good guide to prospective long-term returns – and on our metrics, these are amongst the lowest we’ve seen in recent years.
Is this time different?
Some long-term increase in valuations may be warranted. In recent decades, real interest rates have fallen, while profitability has risen. Some of the latter trend will reflect a lasting shift towards a less capital intensive, and more intangible, product line. The notion that the US CAPE should, for example, revert to its very long-term average is likely misplaced. Moreover, even if they are too high, valuations can clearly overshoot for a while. Keynes famously quipped, “the market can remain irrational longer than you can remain solvent”. And there are lots of tactical reasons for giving the US the benefit of the doubt at the moment – whether it’s the robust cyclical story, broadening earnings growth or even what a Trump presidency might mean for markets in the near term.
None of this means we should be complacent. A lot of good (or improved) news is already in the price and there is simply less valuation headroom today. We should remember that this time eight years ago – after Trump’s first win – stocks were significantly cheaper (CAPE: 21x vs 36x today) and bonds were significantly more expensive (US 10-year yield: 1.8% vs 4.4%). Stock valuations may not yet be flashing red, but they are tilting in that direction.
Ready to begin your journey with us?
Speak to a Client Adviser in the UK or Switzerland
Past performance is not a guide to future performance and nothing in this blog constitutes advice. Although the information and data herein are obtained from sources believed to be reliable, no representation or warranty, expressed or implied, is or will be made and, save in the case of fraud, no responsibility or liability is or will be accepted by Rothschild & Co Wealth Management UK Limited as to or in relation to the fairness, accuracy or completeness of this document or the information forming the basis of this document or for any reliance placed on this document by any person whatsoever. In particular, no representation or warranty is given as to the achievement or reasonableness of any future projections, targets, estimates or forecasts contained in this document. Furthermore, all opinions and data used in this document are subject to change without prior notice.
Read more articles
-

Chips: Moore spending
Strategy Blog
Despite renewed Middle East tensions and oil price spikes, a bigger market question is whether AI investment momentum can justify soaring capital expenditure. Demand remains strong, but investors are increasingly focused on adoption, monetisation and funding sustainability, raising concerns over future earnings, valuations and capital discipline.
-

Rothschild & Co receives five major awards at Euromoney's Awards for Excellence 2026
Awards
Global Advisory has been recognised with five prestigious awards at this year’s Euromoney's Awards for Excellence.
-

Politics on the beach
Strategy Blog
Populism is reshaping politics across the US and Europe, drawing parties away from the traditional centre. Rather than left versus right, voters increasingly divide along establishment versus anti-establishment lines, creating opportunities for populist movements and challenging conventional political assumptions.
-

Rothschild & Co’s UK Wealth Management business continues to strengthen its regional presence with appointment of Samantha Beach in Manchester
Press releases
Rothschild & Co’s UK Wealth Management business continues to strengthen its regional presence with appointment of Samantha Beach in Manchester.
-
Growth Equity Update
Insights
The 52nd Growth Equity Update from Patrick Wellington, Vice-Chairman of Equity Advisory.
-

Monetary policy - behind the curtain
Strategy Blog
Interest rate expectations have shifted markedly in 2026, with markets now anticipating higher rates amid persistent inflation, economic resilience and more hawkish central banks. Despite this, strong AI-driven earnings have supported equities.
