Why this is not 1973


Oil prices have nearly doubled since the start of the coordinated attacks on Iran in February. Brent crude has risen sharply, climbing from around 60 dollars per barrel at the start of the year to around 110 dollars. With the Strait of Hormuz now closed, concerns are mounting that the recent increase in oil prices can have lasting effects on the global economy and financial markets, drawing comparison to the 1973 oil crisis.
The comparison is understandable, but the similarities are limited, and the differences are profound. First, the economic circumstances are fundamentally different; second, today’s economies are structurally less sensitive to oil shocks; and third, the equity market has a fundamentally different composition.
The economic circumstances were different
In the 70's, the economy was heavily reliant on industrial companies and there were little substitutes for oil. Economies were battling with high inflation fueled by strong demand and high salary growth. Unions were very strong and active on wage negotiations. The oil shock exacerbated the situation, intensifying both inflation and oil dependency and pushing economies into a prolonged period of stagflation marked by stagnant growth, high inflation as well as rising unemployment.
Today, the economic landscape is more subdued. Economies are growing at or close to their long-term trends, and while inflation is higher than Central Banks' targets, it is by no means out of control. Wages are growing slower than inflation, while unionisation rates have fallen considerably, standing at around 15% for OECD economies today[1], compared to more than 38% in the 1970s.
Today’s economy is less oil‑centric and more resilient
The 1973 crisis was triggered by a deliberate supply cut. Oil prices nearly quadrupled within months, at a time when oil accounted for roughly half of global energy consumption and viable alternatives were scarce. Western economies were highly oil‑intensive, strategic reserves were limited, and the result was a brutal stagflationary shock that reshaped macroeconomic policy frameworks. Back then, the global economy would consume approximately 1 barrel of oil for each USD 1,000 worth of GDP[2], adjusted for inflation (this is known as the economy's oil intensity).
By contrast, in 2026 oil represents closer to one third of global energy consumption. Natural gas, nuclear power, and renewables play a far greater role, and while substituting away from oil is neither easy nor complete, it is at least feasible. Strategic petroleum reserves now exist and are actively coordinated, providing an important buffer against sudden disruptions. Today, only 0.4 barrels are consumed per USD 1,000 worth of GDP. This reduction of oil intensity is true across the world, China included.
Oil consumption per unit of GDP*
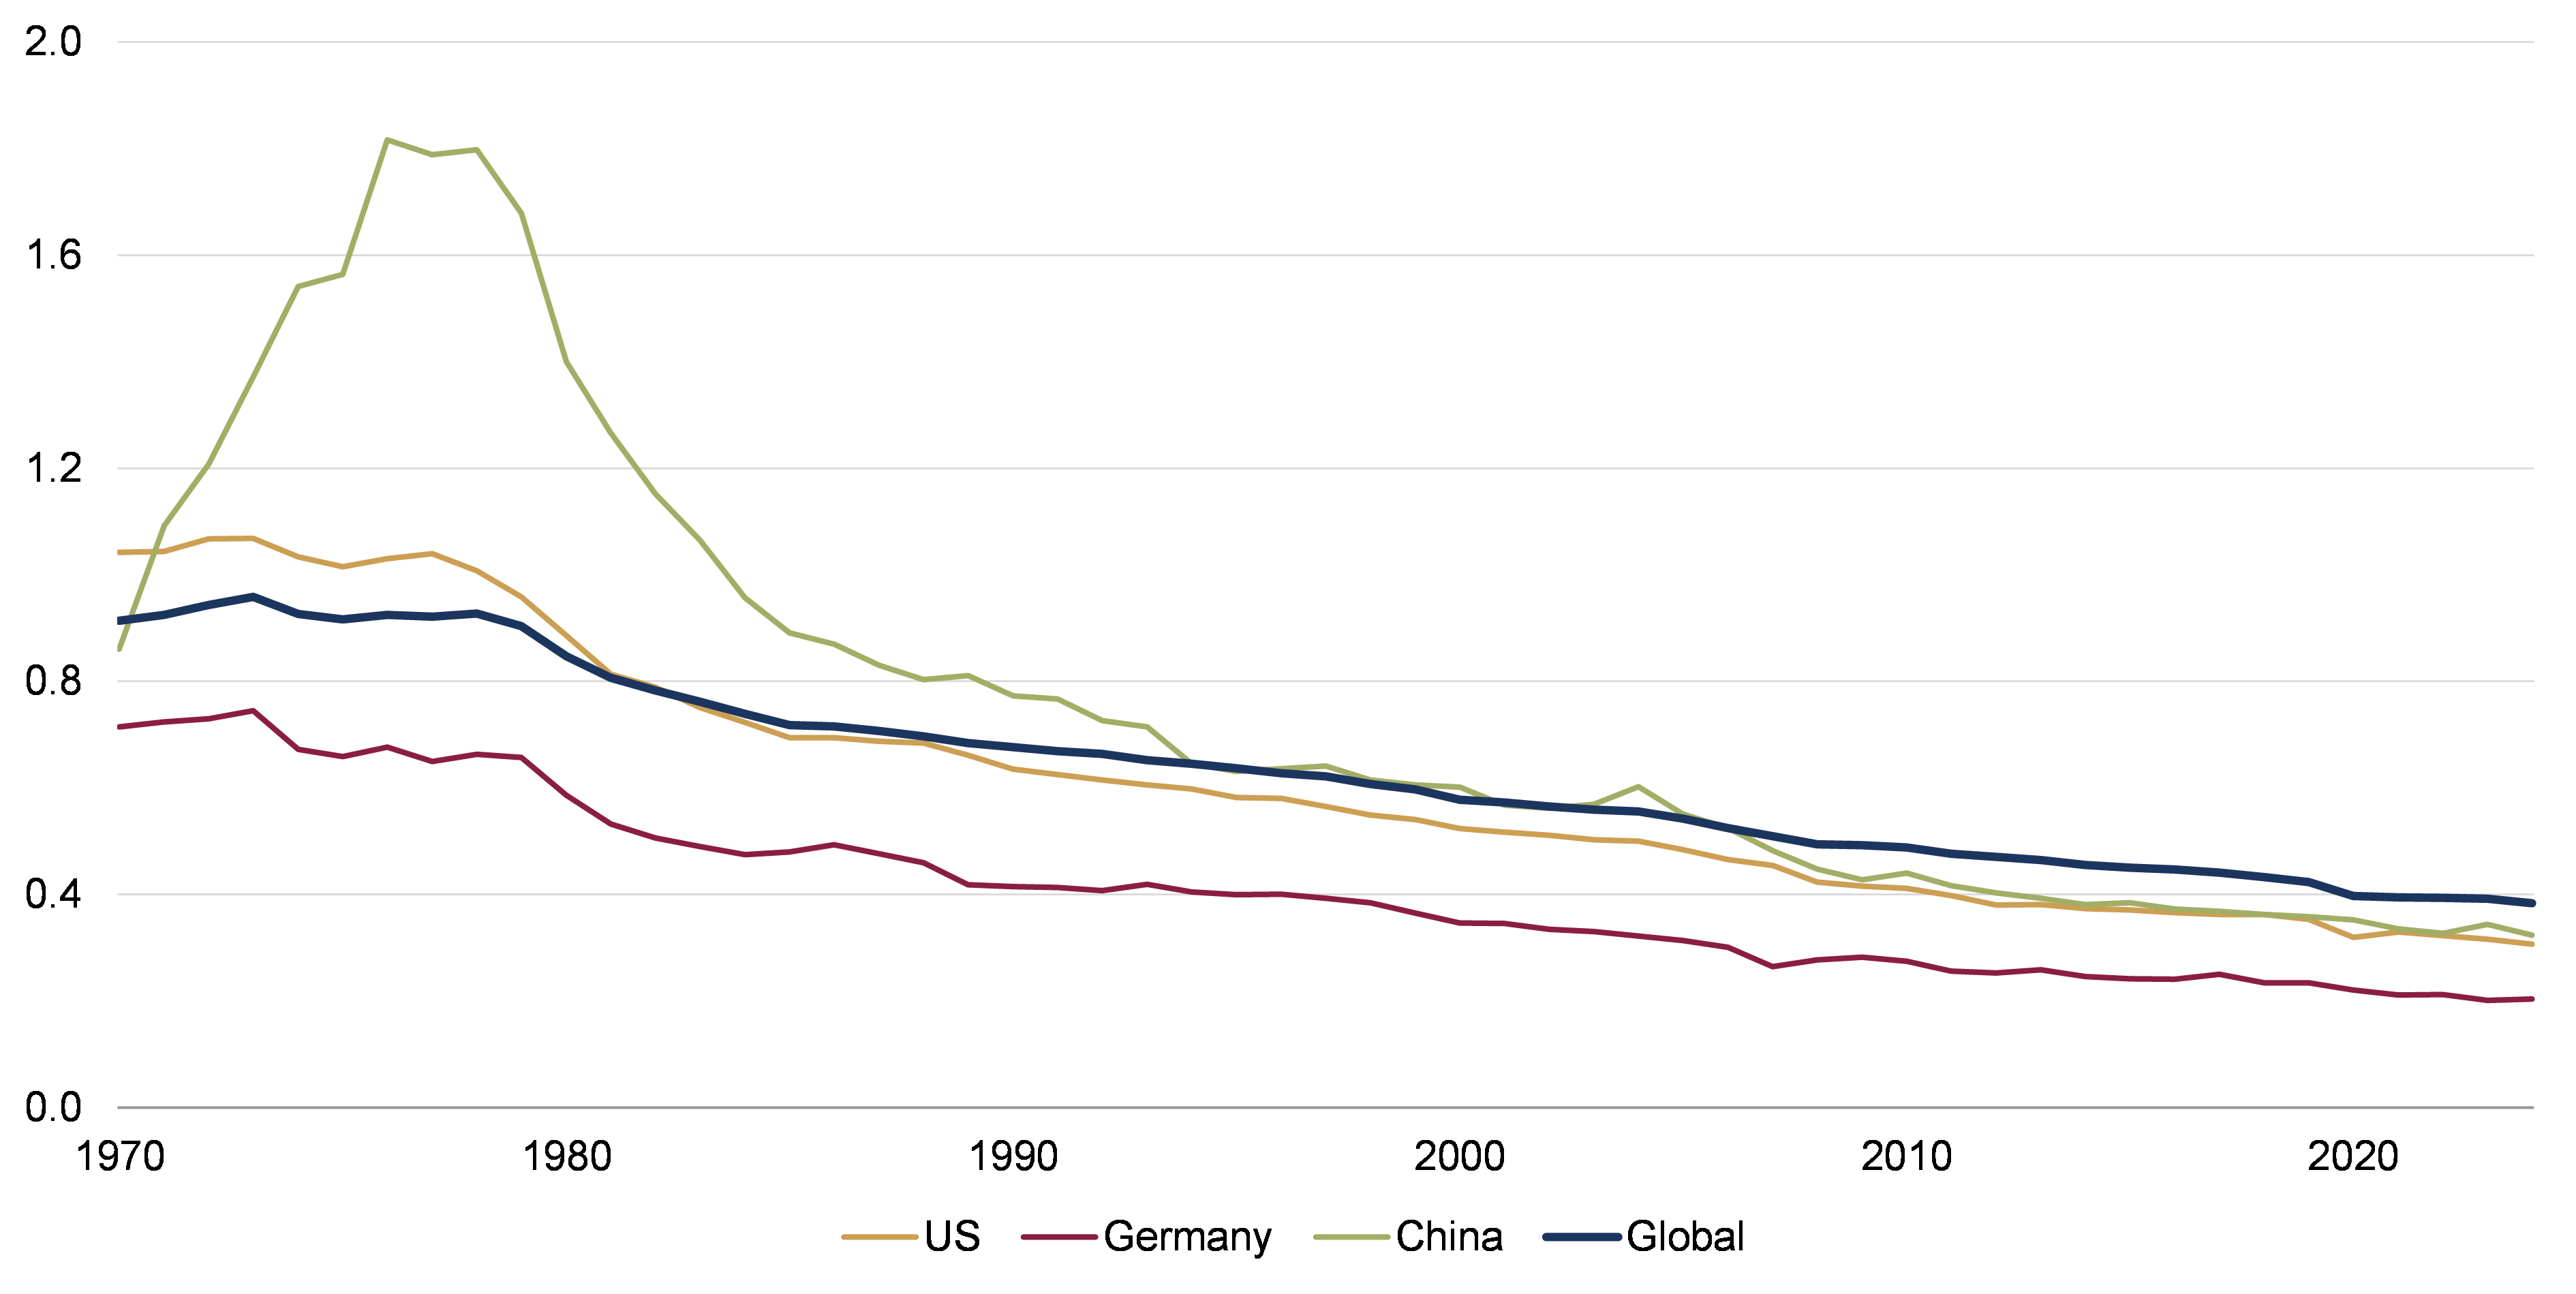
Source: Rothschild & Co, Bloomberg, BP Statistical Review, World Bank, author’s calculations *Oil intensity is the number of barrels of oil consumed per USD1,000 of GDP each year (GDP is in 2015 constant prices). Past performance is not indicative of future performance and the value of investments and income from them can fall as well as rise. Correct to 26 March 2026.
Equity markets have structurally reduced their dependence on energy
Since the mid‑1970s, equity markets have evolved in ways that materially reduce their direct exposure to oil and altered how energy shocks are transmitted into equity performance.
In 1973, equity indices mirrored an industrial, energy‑intensive economy. The S&P 500 was anchored by manufacturing, energy, and telecommunications, with firms such as Exxon, General Motors, Ford Motor Company, Texaco, and Guld Oil, whose profitability was tightly linked to physical inputs, above all oil. In that environment, energy was a fundamental input, so oil shocks quickly translated into margin compression, higher inflation, and broad‑based equity stress.
Today’s indices look very different. The top ten stocks account for roughly 40% of major US indices, dominated by mega‑cap technology and platform companies whose value creation depends on software, data, and intellectual property rather than raw materials. This shift has reduced headline equity sensitivity to commodity cycles while increasing exposure to interest rates, regulation, and valuation dynamics.
The concept of energy intensity helps explain why this matters. The sectors that dominated markets in the 1970s, namely manufacturing, transportation, utilities, and materials, were highly energy intensive. Rising energy prices fed directly and mechanically into costs and margins across the index. At present, those sectors only account for about 20% of the global market. Today’s market leaders sit at the opposite end of the spectrum. Technology and financials, accounting for more than 40% of the global market, are among the least energy‑intensive sectors, with largely intangible outputs that scale with minimal incremental energy input. This change structurally weakens the traditional oil‑to‑inflation‑to‑earnings transmission mechanism that once defined equity market behavior.
Valuations reflect structure, not just optimism
These structural shifts also shape how valuations should be interpreted. A market dominated by low‑energy‑intensity, asset‑light sectors naturally commands different valuation metrics than the industrial, capital‑heavy markets of the past.
Valuations appear elevated relative to long‑term averages largely because technology and other asset‑light sectors, characterised by scalability, pricing power, and lower capital intensity, now dominate indices. Crucially, fundamentals remain supportive: these sectors have limited direct exposure to energy input costs, insulating margins from oil price volatility. Higher energy prices tend to affect equities today indirectly through discount rates or policy expectations rather than through immediate cost inflation.
As a result, valuation premiums reflect a more durable earnings base rather than simple optimism, making today’s valuation profile more resilient than it would have been under earlier market structures.
Markets are pricing inflation risk, not recession
Since the Middle East conflict began in late February 2026, markets have moved from an initial shock to a fragile but more measured equilibrium. Oil prices and volatility jumped early as energy supply risks pushed inflation expectations and bond yields higher, while equities sold off before stabilising as the conflict was seen as severe but contained and earnings, especially in US large‑cap tech, proved resilient. More recently, volatility has eased, credit markets remain calm, and equities have traded in ranges, responding partly to swings in oil prices and headlines around the conflict.
Portfolio implications: discipline over reaction
Markets are not ignoring the war, they are pricing it as an inflationary headwind rather than a systemic crisis, leaving conditions sensitive to any escalation or de‑escalation.
For long‑term investors, the key takeaway is to remain disciplined and focused on the long view, an approach that underpins how we invest on behalf of our clients. While the Middle East conflict has increased market volatility and pushed inflation and interest‑rate expectations higher, history suggests these forces tend to influence markets more in the short term than over extended investment horizons. Over time, markets have consistently shown an ability to absorb geopolitical shocks and refocus on fundamentals such as earnings growth, innovation, and balance‑sheet strength.
Against this backdrop, we remain vigilant, continuously assessing risks and ensuring our asset allocation is appropriately positioned to both withstand periods of volatility and take advantage of opportunities as they emerge. Rather than reacting to headlines, we believe long‑term outcomes are best supported by staying invested, maintaining diversification, and using periods of market volatility as opportunities to rebalance portfolios, rather than retreating from risk.
[1] Membership of unions and employers’ organisations, and bargaining coverage: Standing, but losing ground, OECD, 2025
[2] Oil Intensity: The Curiously Steady Decline of Oil in GDP, Columbia Climate School, 2021
Our insights, your investment journey
This article is produced by Rothschild & Co Bank AG, Zollikerstrasse 181, 8034 Zurich, for information and marketing purposes only. It does not constitute a personal recommendation, an advice, an offer or an invitation to buy or sell securities or any other banking or investment product. Nothing in this article constitutes legal, accounting or tax advice. Although the information and data herein are obtained from sources believed to be reliable, no representation or warranty, expressed or implied, is or will be made and save in the case of fraud, no responsibility or liability is or will be accepted by Rothschild & Co Bank AG as to or in relation to the fairness, accuracy or completeness of this document or the information forming the basis of this article or for any reliance placed on this article by any person whatsoever.
In particular, no representation or warranty is given as to the achievement or reasonableness of any future projections, targets, estimates or forecasts contained in this articlet. Furthermore, all opinions and data used in this articlet are subject to change without prior notice. Law or other regulation may restrict the distribution of this article in certain jurisdictions. Accordingly, recipients of this article should inform themselves about and observe all applicable legal and regulatory requirements. Neither this article nor any copy thereof may be sent to or taken into the United States or distributed in the United States or to a US person. Rothschild & Co Bank AG is authorised and regulated by the Swiss Financial Market Supervisory Authority FINMA.
Read more articles
-

Chips: Moore spending
Strategy Blog
Despite renewed Middle East tensions and oil price spikes, a bigger market question is whether AI investment momentum can justify soaring capital expenditure. Demand remains strong, but investors are increasingly focused on adoption, monetisation and funding sustainability, raising concerns over future earnings, valuations and capital discipline.
-

Rothschild & Co receives five major awards at Euromoney's Awards for Excellence 2026
Awards
Global Advisory has been recognised with five prestigious awards at this year’s Euromoney's Awards for Excellence.
-

Politics on the beach
Strategy Blog
Populism is reshaping politics across the US and Europe, drawing parties away from the traditional centre. Rather than left versus right, voters increasingly divide along establishment versus anti-establishment lines, creating opportunities for populist movements and challenging conventional political assumptions.