Strategy blog: Peak US inflation?
Last week’s US inflation report presented us with another surprise… but a welcome one this time.
The headline inflation rate softened to 8.5% (y/y) in July – below expectations for the first time in 18 months – while core CPI was unchanged at 5.9%. Falling energy prices were the primary driver of the weaker headline reading, though price pressure from the ‘goods’ category also cooled off.
We’ve become accustomed to ‘premature peaks’ in headline inflation rates in the post-pandemic world and there’s no denying that broad-based price pressures were still evident across the CPI basket. For instance, the Cleveland Fed’s median and trimmed-mean CPI series – which rank the distribution of monthly price changes, then omit ‘outliers’ to capture a cleaner underlying inflation trend – continued to move higher in year-over-year terms in July, albeit at lower rates (Chart 1).
Chart 1: Cleveland Fed median and trimmed-mean CPI (annual change, %)
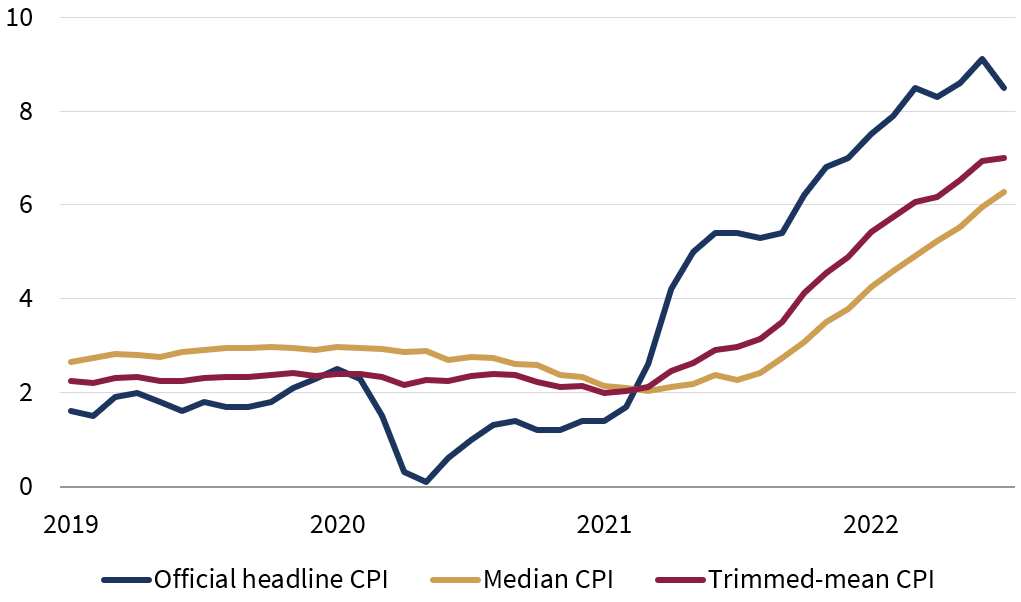
Note: Trimmed-mean CPI removes the top 8% and bottom 8% of items in the ranked distribution.
Source: Rothschild & Co, Bloomberg, Federal Reserve Bank of Cleveland
Yet, there are growing signs that last week’s rollover may not be another false summit.
First, firms’ input prices appear to be moderating. The ISM Prices Paid sub-indices – reflecting the costs faced by firms – moved lower for manufacturing and service sector companies (Chart 2). Costs are still rising as both series were printing above the 50-mark, but they are doing so at a much slower pace – particularly for manufacturers. Further evidence emerged from the latest US Producer Price Index – the price of goods as they leave their place of production – which also retreated in July (the first monthly decline since April 2020).
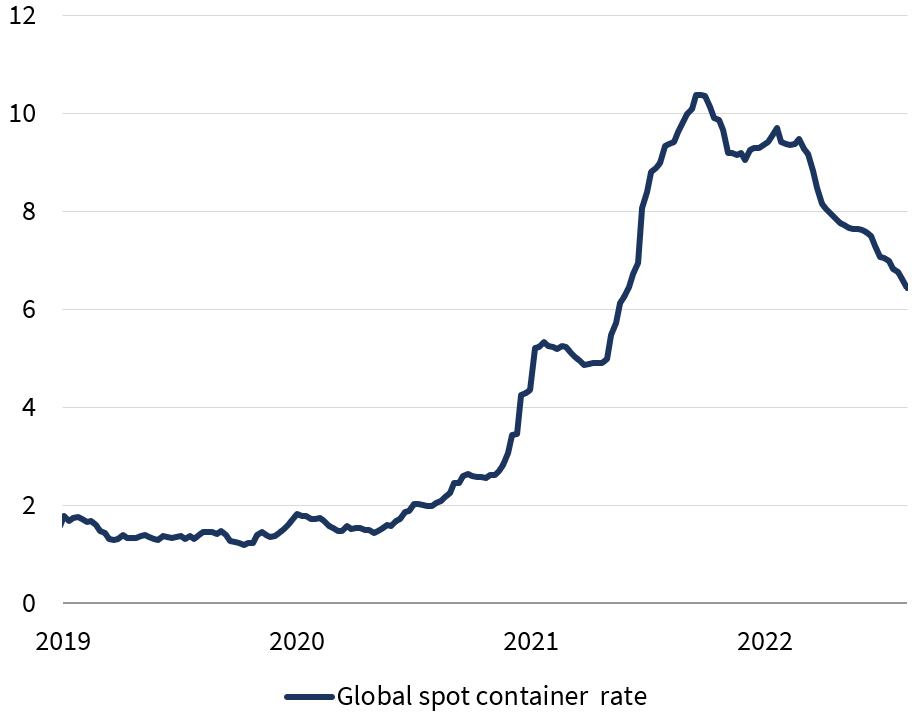
Second, we appear to have passed the peak of supply chain stress, China notwithstanding. Global container shipping costs have declined for months and are now lower than they were a year ago (Chart 3). Separately, the New York Fed’s Global Supply Chain Pressure Index has also continued to roll over. As a result, the ‘supply shortage’ narrative should gradually dissipate and transport costs should continue to ease for firms (there may be a lag though, as most companies tend to lock-in shipping costs via contractual rates to avoid exposure to volatile spot rates).
Chart 2: US ISM Prices Paid (Diffusion index, 50 = ‘no change’)
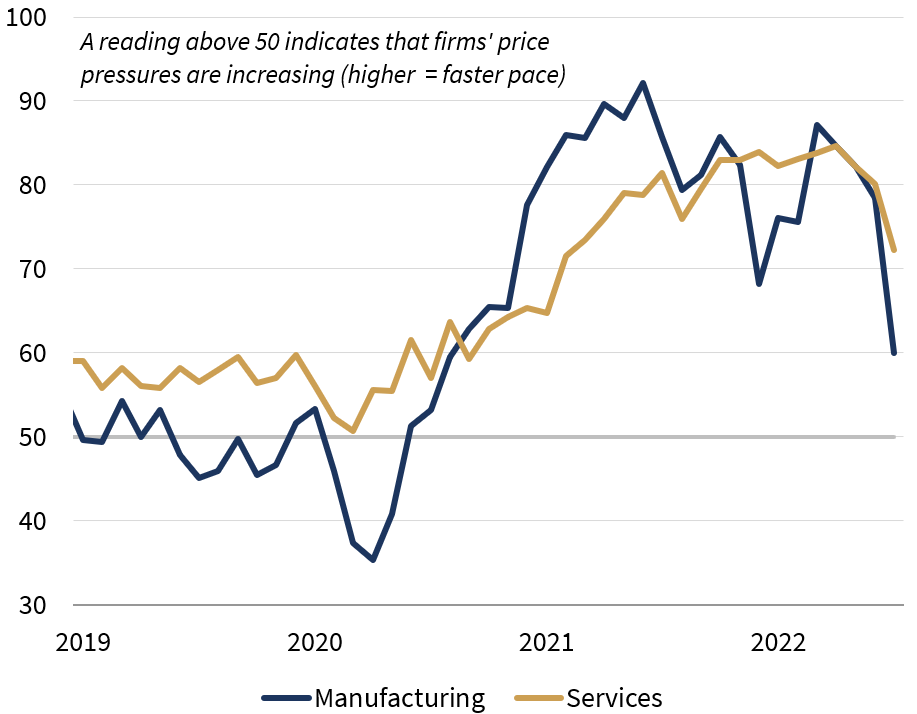
Source: Rothschild & Co, Bloomberg, Institute for Supply Management, Drewry Research
Chart 3: Spot container rates (USD per 40ft container, thousands)
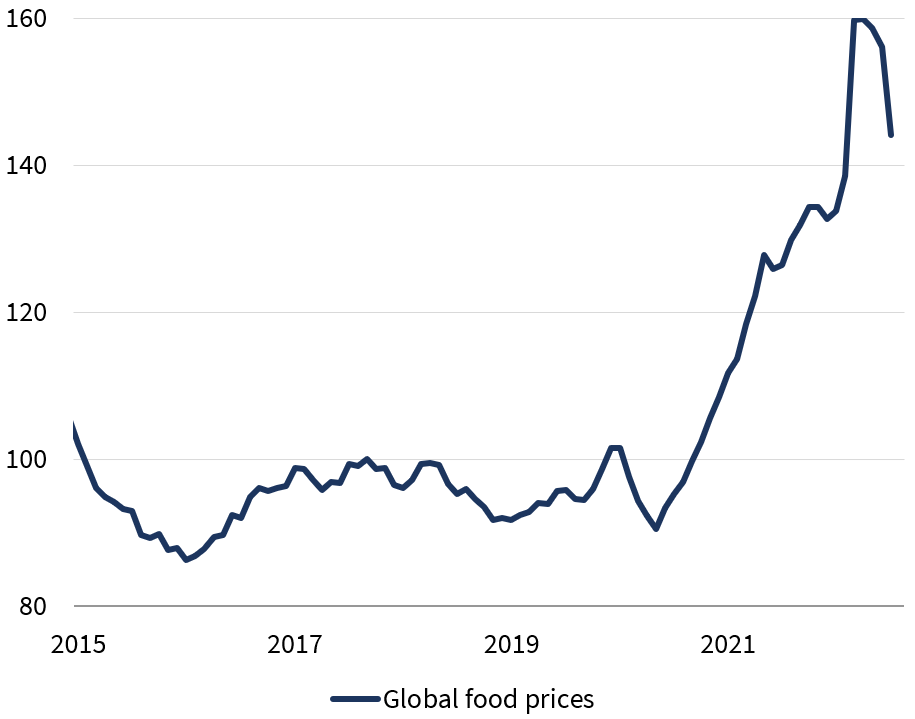
Third, the more volatile energy and food components may have topped out. US gasoline prices – which account for over 50% of the energy basket – fell during the first half of August (Chart 4), and so energy price disinflation is likely to occur (again) in next month’s release. Moreover, global food prices have declined, according to the monthly UN FAO Food Price Index (Chart 5). This, in turn, should gradually feed through to lower US food inflation in the coming months.
Chart 4: US gasoline prices and energy CPI (annual change, %)
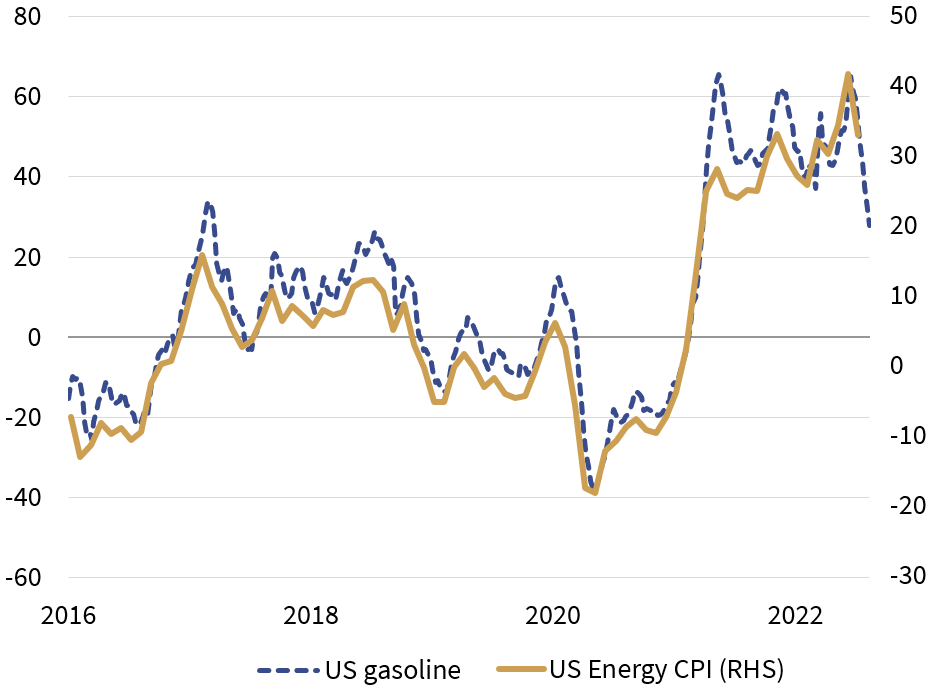
Source: Rothschild & Co, Refinitiv Datastream, US Bureau of Labor Statistics, Food and Agriculture Organization of the UN
Chart 5: FAO World Food Price Index (seasonally adjusted index)
Of course, there’s no denying that the trajectory back to 2% inflation will be challenging: commentators will likely shift their attention to the stickier and more persistent price pressures – such as shelter prices – alongside ongoing geopolitical risks. And most importantly, the jury is still out on how vigorously wages will respond: the wage/price spiral remains a risk.
Nonetheless, the underlying observations are encouraging, and we continue to think that inflation is likely to settle in the above-target 2-4% inflation range in the medium-term – still higher than the Fed’s target, but not too far above it.
Ready to begin your journey with us?
Past performance is not a guide to future performance and nothing in this blog constitutes advice. Although the information and data herein are obtained from sources believed to be reliable, no representation or warranty, expressed or implied, is or will be made and, save in the case of fraud, no responsibility or liability is or will be accepted by Rothschild & Co Wealth Management UK Limited as to or in relation to the fairness, accuracy or completeness of this document or the information forming the basis of this document or for any reliance placed on this document by any person whatsoever. In particular, no representation or warranty is given as to the achievement or reasonableness of any future projections, targets, estimates or forecasts contained in this document. Furthermore, all opinions and data used in this document are subject to change without prior notice.
Read more articles
-
Growth Equity Update
Insights
The 52nd Growth Equity Update from Patrick Wellington, Vice-Chairman of Equity Advisory.
-

Monetary policy - behind the curtain
Strategy Blog
Interest rate expectations have shifted markedly in 2026, with markets now anticipating higher rates amid persistent inflation, economic resilience and more hawkish central banks. Despite this, strong AI-driven earnings have supported equities.
-

Stories from the road
Quarterly Letter
Through deep research and direct engagement with businesses, we seek high-quality companies with strong competitive advantages, disciplined capital allocation and the ability to compound wealth over time.
-

Bringing the right advisers together
Insights
Significant wealth brings complex financial and personal decisions. Rothschild & Co helps coordinate trusted advisers, ensuring aligned, objective guidance, long-term planning and access to specialist expertise through a personalised advisory board.
-

Five stock market talking points in 2026
Strategy Blog
Global equities rose despite geopolitical tensions, as markets looked through near-term risks. AI infrastructure spending drove returns and earnings growth, valuations sent mixed signals, and corporate activity remained subdued but showed signs of recovery.