Monthly Market Summary: May 2022
 Investment Insights Team, Investment Strategist Team, Wealth Management
Summary: Modest stock gains after a challenging month
Capital markets were volatile through May. After the longest series of weekly losses for major equity indices since 2001, equities recovered by month-end, while regional bond yields diverged. Over the month, global equities rose 0.1% (in USD terms), while global government bonds fell 0.5% (in USD). Key themes included:
- The Fed and ECB signal tighter monetary policy ahead;
- Activity momentum slows, but underlying GDP growth continues;
- Warnings about impact on corporate earnings by supply chain disruptions.
US stocks briefly entered ‘bear market’ territory mid-month as negative news flow and fears of a policy overshoot – and wider ‘hard landing’ risks - dominated sentiment. A flight to safety saw government bonds briefly in demand, with 10-year treasury yields falling to 2.7%, before unwinding gains into the month-end. Despite an overall solid corporate earnings season, some blue-chip names disappointed, warning of ongoing supply chain issues. More positively, China unveiled some easing of Covid-19 restrictions and further policy stimulus, offering some month-end respite to stock markets. Crude oil prices rose as the EU mulled a bloc-wide ban of Russian oil.
US: Hawkish Fed; Peak Inflation?; Solid PMI data
As expected, the Fed raised its main policy rate by 0.5% and announced the scaling back of its balance sheet (‘QT’) from June. Fed Chair Powell also signalled a steeper path of hiking - further 50bps hikes at the upcoming meetings. The annual inflation rate for April eased to 8.3% (from a 41-year high of 8.5% in March), marking a possible cycle peak. Meanwhile, hard data for April suggested that the US economy has decent momentum: the unemployment rate remained at 3.6%, while retail sales rose by 8.2% yoy (up from 7.3% in March) and industrial production expanded by 6.4% yoy (up from 5.4%). Timelier business survey data for May suffered from higher input costs and concerns about higher interest rates, but still signal solid growth. The S&P Global Services PMI fell to a four-month low of 53.5 (from 55.6 in April) and the Manufacturing PMI fell to 57.5 (from 59.2), the lowest value in three months.
Europe: ECB’s July lift-off; Inflation pressures build; Softer PMI data
ECB Chief, Christine Lagarde, signalled the first interest rate hike in a decade from July – shortly after the ECB concludes its bond purchase programme (APP). Money markets have discounted four hikes in the second half of 2022, with the year-end deposit rate close to +0.5%. Preliminary estimates of the annual inflation rate for the Euro Area increased to a record 8.1% in May (up from 7.4% in April), as energy and food costs continued to move higher. The S&P Global Eurozone Manufacturing PMI fell to 54.6 in May (from 55.5 in April), the lowest reading since November 2020 due to concerns about the outlook of prices, supply chains and demand. EU leaders agreed to cut 90% of oil imports from Russia by sanctioning Russian crude oil that is delivered by shipments.
ROW: Chinese PMI data recover; mixed news in Japan
The NBS Manufacturing PMI for China rose 49.6 in May from April's 26-month low of 47.4, amid an easing of Covid-19 restrictions. This print marked the third straight month of contraction – the same applies to the Non-Manufacturing PMI which rose to 47.8. Yet, the announcement of stimulus measures improved investor sentiment. In Japan, industrial production decreased 4.8% yoy in April while retail sales rose by 2.9% yoy.
Performance figures (as of 31/05/2022 in local currency)
| Fixed Income | Yield | 1 M % | YTD % |
|---|---|---|---|
| US 10 Yr | 2.85% | 0.7% | -9.9% |
| UK 10 Yr | 2.10% | -1.0% | -7.5% |
| Swiss 10 Yr | 0.89% | 0.0% | -6.6% |
| German 10 Yr | 1.12% | -1.3% | -9.8% |
| Global IG (hdg $) | 3.77% | 0.2% | -10.5% |
| Global HY (hdg $) | 7.59% | -0.4% | -8.9% |
| Equity Index | Level | 1 M % | YTD % |
|---|---|---|---|
| MSCI World($) | 339 | 0.1% | -12.8% |
| S&P 500 | 4,132 | 0.2% | -12.8% |
| MSCI UK | 13,827 | 1.3% | 7.2% |
| SMI | 11,611 | -4.1% | -7.4% |
| Eurostoxx 50 | 3,789 | 1.3% | -9.5% |
| DAX | 14,388 | 2.1% | -9.4% |
| CAC | 6,469 | 0.5% | -7.4% |
| Hang Seng | 21,415 | 2.2% | -7.6% |
| MSCI EM ($) | 537 | 0.4% | -11.8% |
| Currencies (trade-weighted, nominal) | 1 M % | YTD % |
|---|---|---|
| US Dollar | -1.0% | 3.5% |
| Euro | 0.9% | -1.0% |
| Yen | 0.5% | -8.8% |
| Pound Sterling | 1.4% | -1.8% |
| Swiss Franc | -0.4% | -2.9% |
| Chinese Yuan | -3.0% | -3.6% |
| Commodities | Level | 1 M % | YTD % |
|---|---|---|---|
| Gold ($/oz) | 1,837 | -3.1% | 0.4% |
| Brent ($/bl) | 122.84 | 12.3% | 57.9% |
| Copper ($/t) | 9,446 | -3.3% | -3.0% |
Source: Bloomberg, Rothschild & Co.
Purchasing Manager Indices (PMIs)
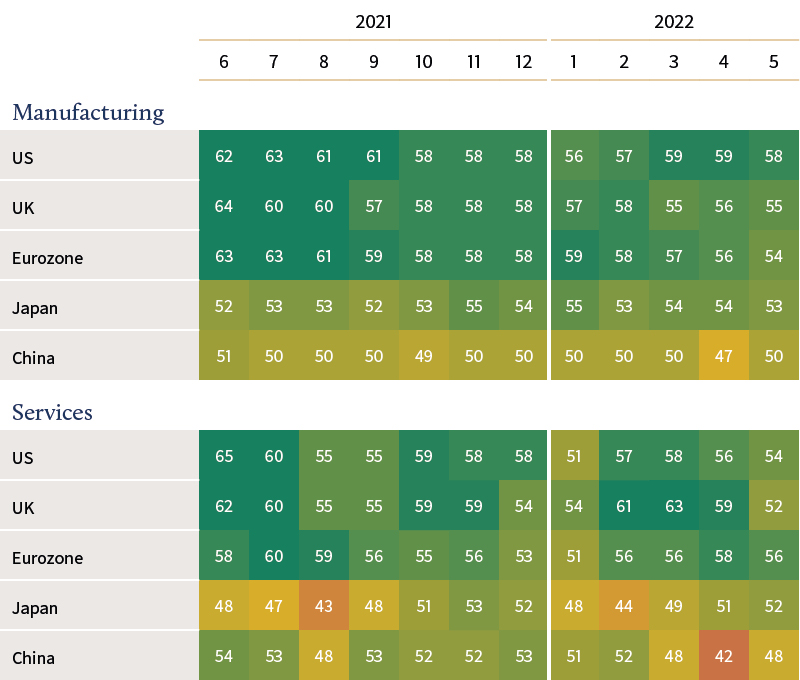
Source: Bloomberg, Rothschild & Co, 01.06.2021-31.05.2022
Related Files
Download the full Monthly Market Summary (PDF 197 KB)
Read more articles
-

Chips: Moore spending
Strategy Blog
Despite renewed Middle East tensions and oil price spikes, a bigger market question is whether AI investment momentum can justify soaring capital expenditure. Demand remains strong, but investors are increasingly focused on adoption, monetisation and funding sustainability, raising concerns over future earnings, valuations and capital discipline.
-

Rothschild & Co receives five major awards at Euromoney's Awards for Excellence 2026
Awards
Global Advisory has been recognised with five prestigious awards at this year’s Euromoney's Awards for Excellence.
-

Politics on the beach
Strategy Blog
Populism is reshaping politics across the US and Europe, drawing parties away from the traditional centre. Rather than left versus right, voters increasingly divide along establishment versus anti-establishment lines, creating opportunities for populist movements and challenging conventional political assumptions.
-

Rothschild & Co’s UK Wealth Management business continues to strengthen its regional presence with appointment of Samantha Beach in Manchester
Press releases
Rothschild & Co’s UK Wealth Management business continues to strengthen its regional presence with appointment of Samantha Beach in Manchester.
-
Growth Equity Update
Insights
The 52nd Growth Equity Update from Patrick Wellington, Vice-Chairman of Equity Advisory.
-

Monetary policy - behind the curtain
Strategy Blog
Interest rate expectations have shifted markedly in 2026, with markets now anticipating higher rates amid persistent inflation, economic resilience and more hawkish central banks. Despite this, strong AI-driven earnings have supported equities.
