Five observations from stock markets in 2025

Despite an eventful year, global stocks have risen by almost 7% in dollar terms and notched all-time highs in June. As we approach the midway mark of 2025, we highlight five eye-catching observations from stock markets.
1. Make Europe Great Again
The US market has unusually underperformed this year, up by just 2%. Meanwhile, European stocks and parts of Asia, such as China, have returned closer to 20% in dollar terms. The MSCI Europe index has rarely outperformed the US equivalent over the past decade-and-a-half, yet we have so far witnessed the largest European outperformance in 20 years in dollar terms (figure 1). That spread is admittedly narrower in local currency terms – around 7 percentage points – as more than half of Europe’s year-to-date gain can be attributed to this year’s weaker dollar. Nonetheless, Trump’s policies may have sparked some renewed investor appetite for European stocks – perhaps ‘MEGA’ is a more appropriate label?
Figure 1: US and European stock market return gap
MSCI US and Europe indices (US dollar terms, percentage points)
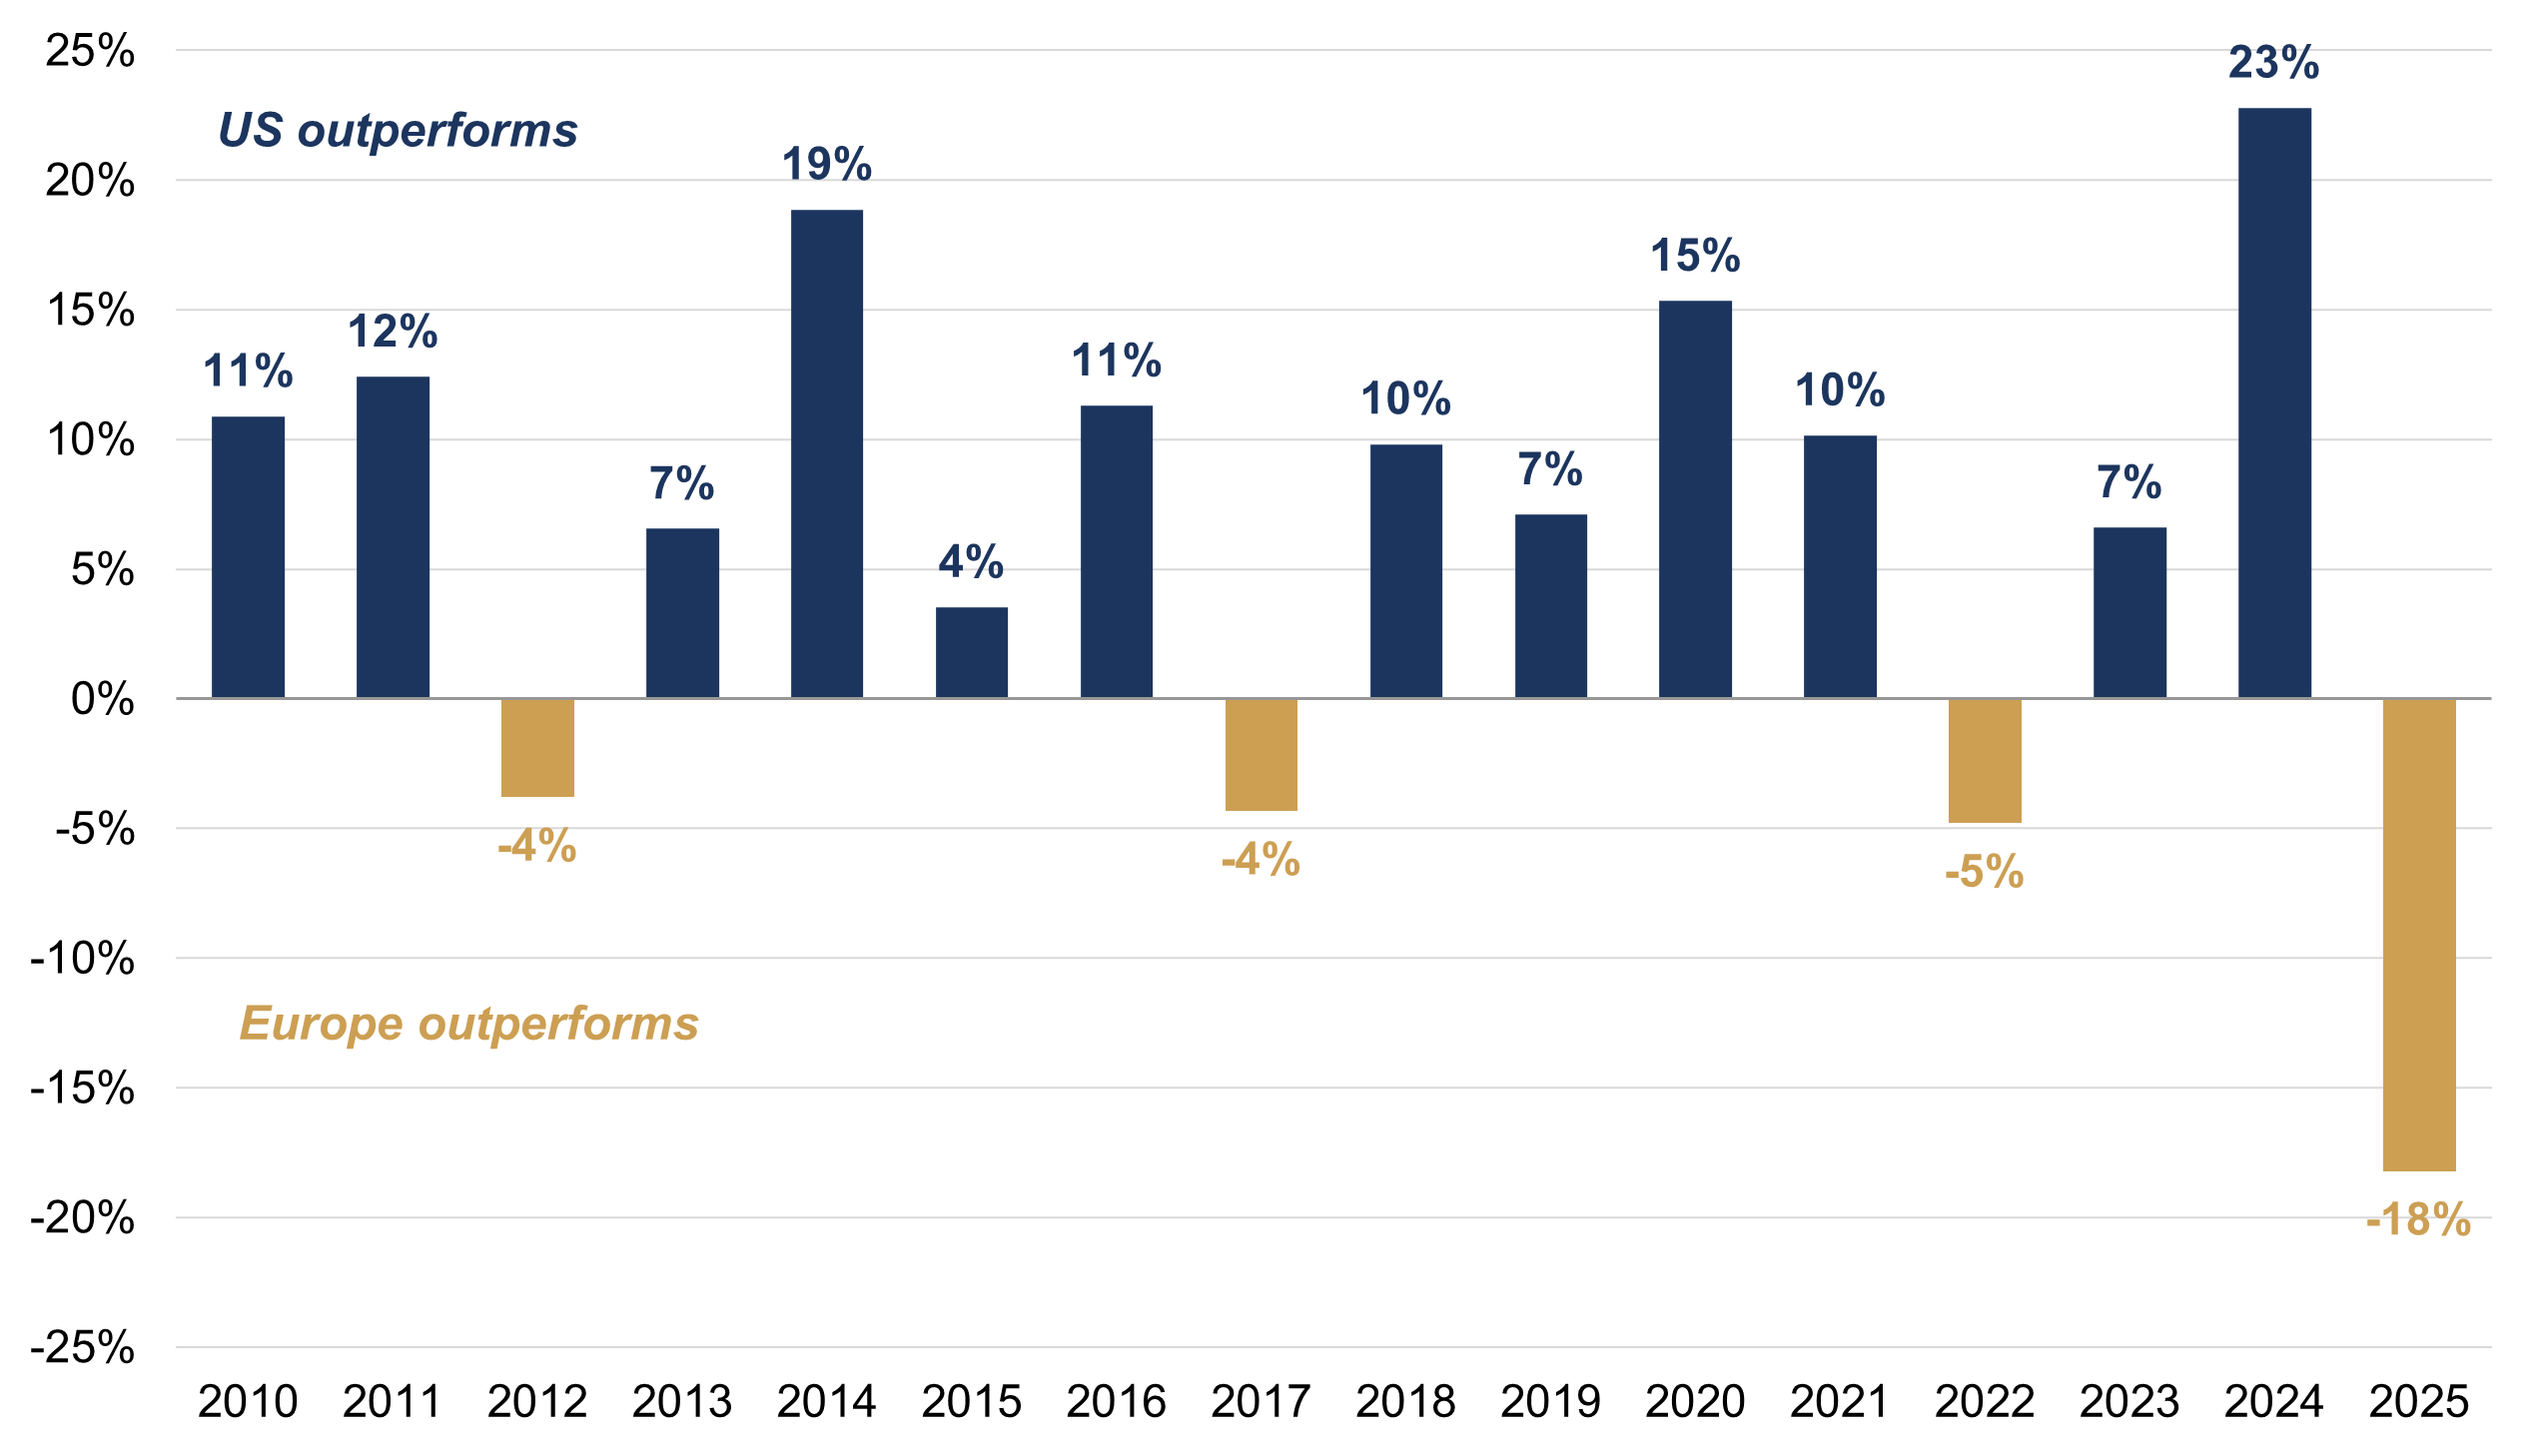
Source: Rothschild & Co, Bloomberg, MSCI
2. AI momentum loses steam
The US’s strong run in 2023 and 2024 was largely due to the AI-related ‘Magnificent Seven’1 (M7) cohort. These seven mega-cap US technology stocks accounted for more than half of the US stock index’s 25% return in each of the past two years (figure 2). However, the M7 are down modestly in 2025 on a market capitalisation weighted basis, coinciding with this year’s US underperformance. The cohort has regained momentum this quarter, but performance has nonetheless been fragmented, with returns ranging from -20% to +20% for the year. As noted, market participation has at least broadened, with other sectors and regions outperforming in 2025.
Figure 2: Contribution to annual global stock return
US dollar terms
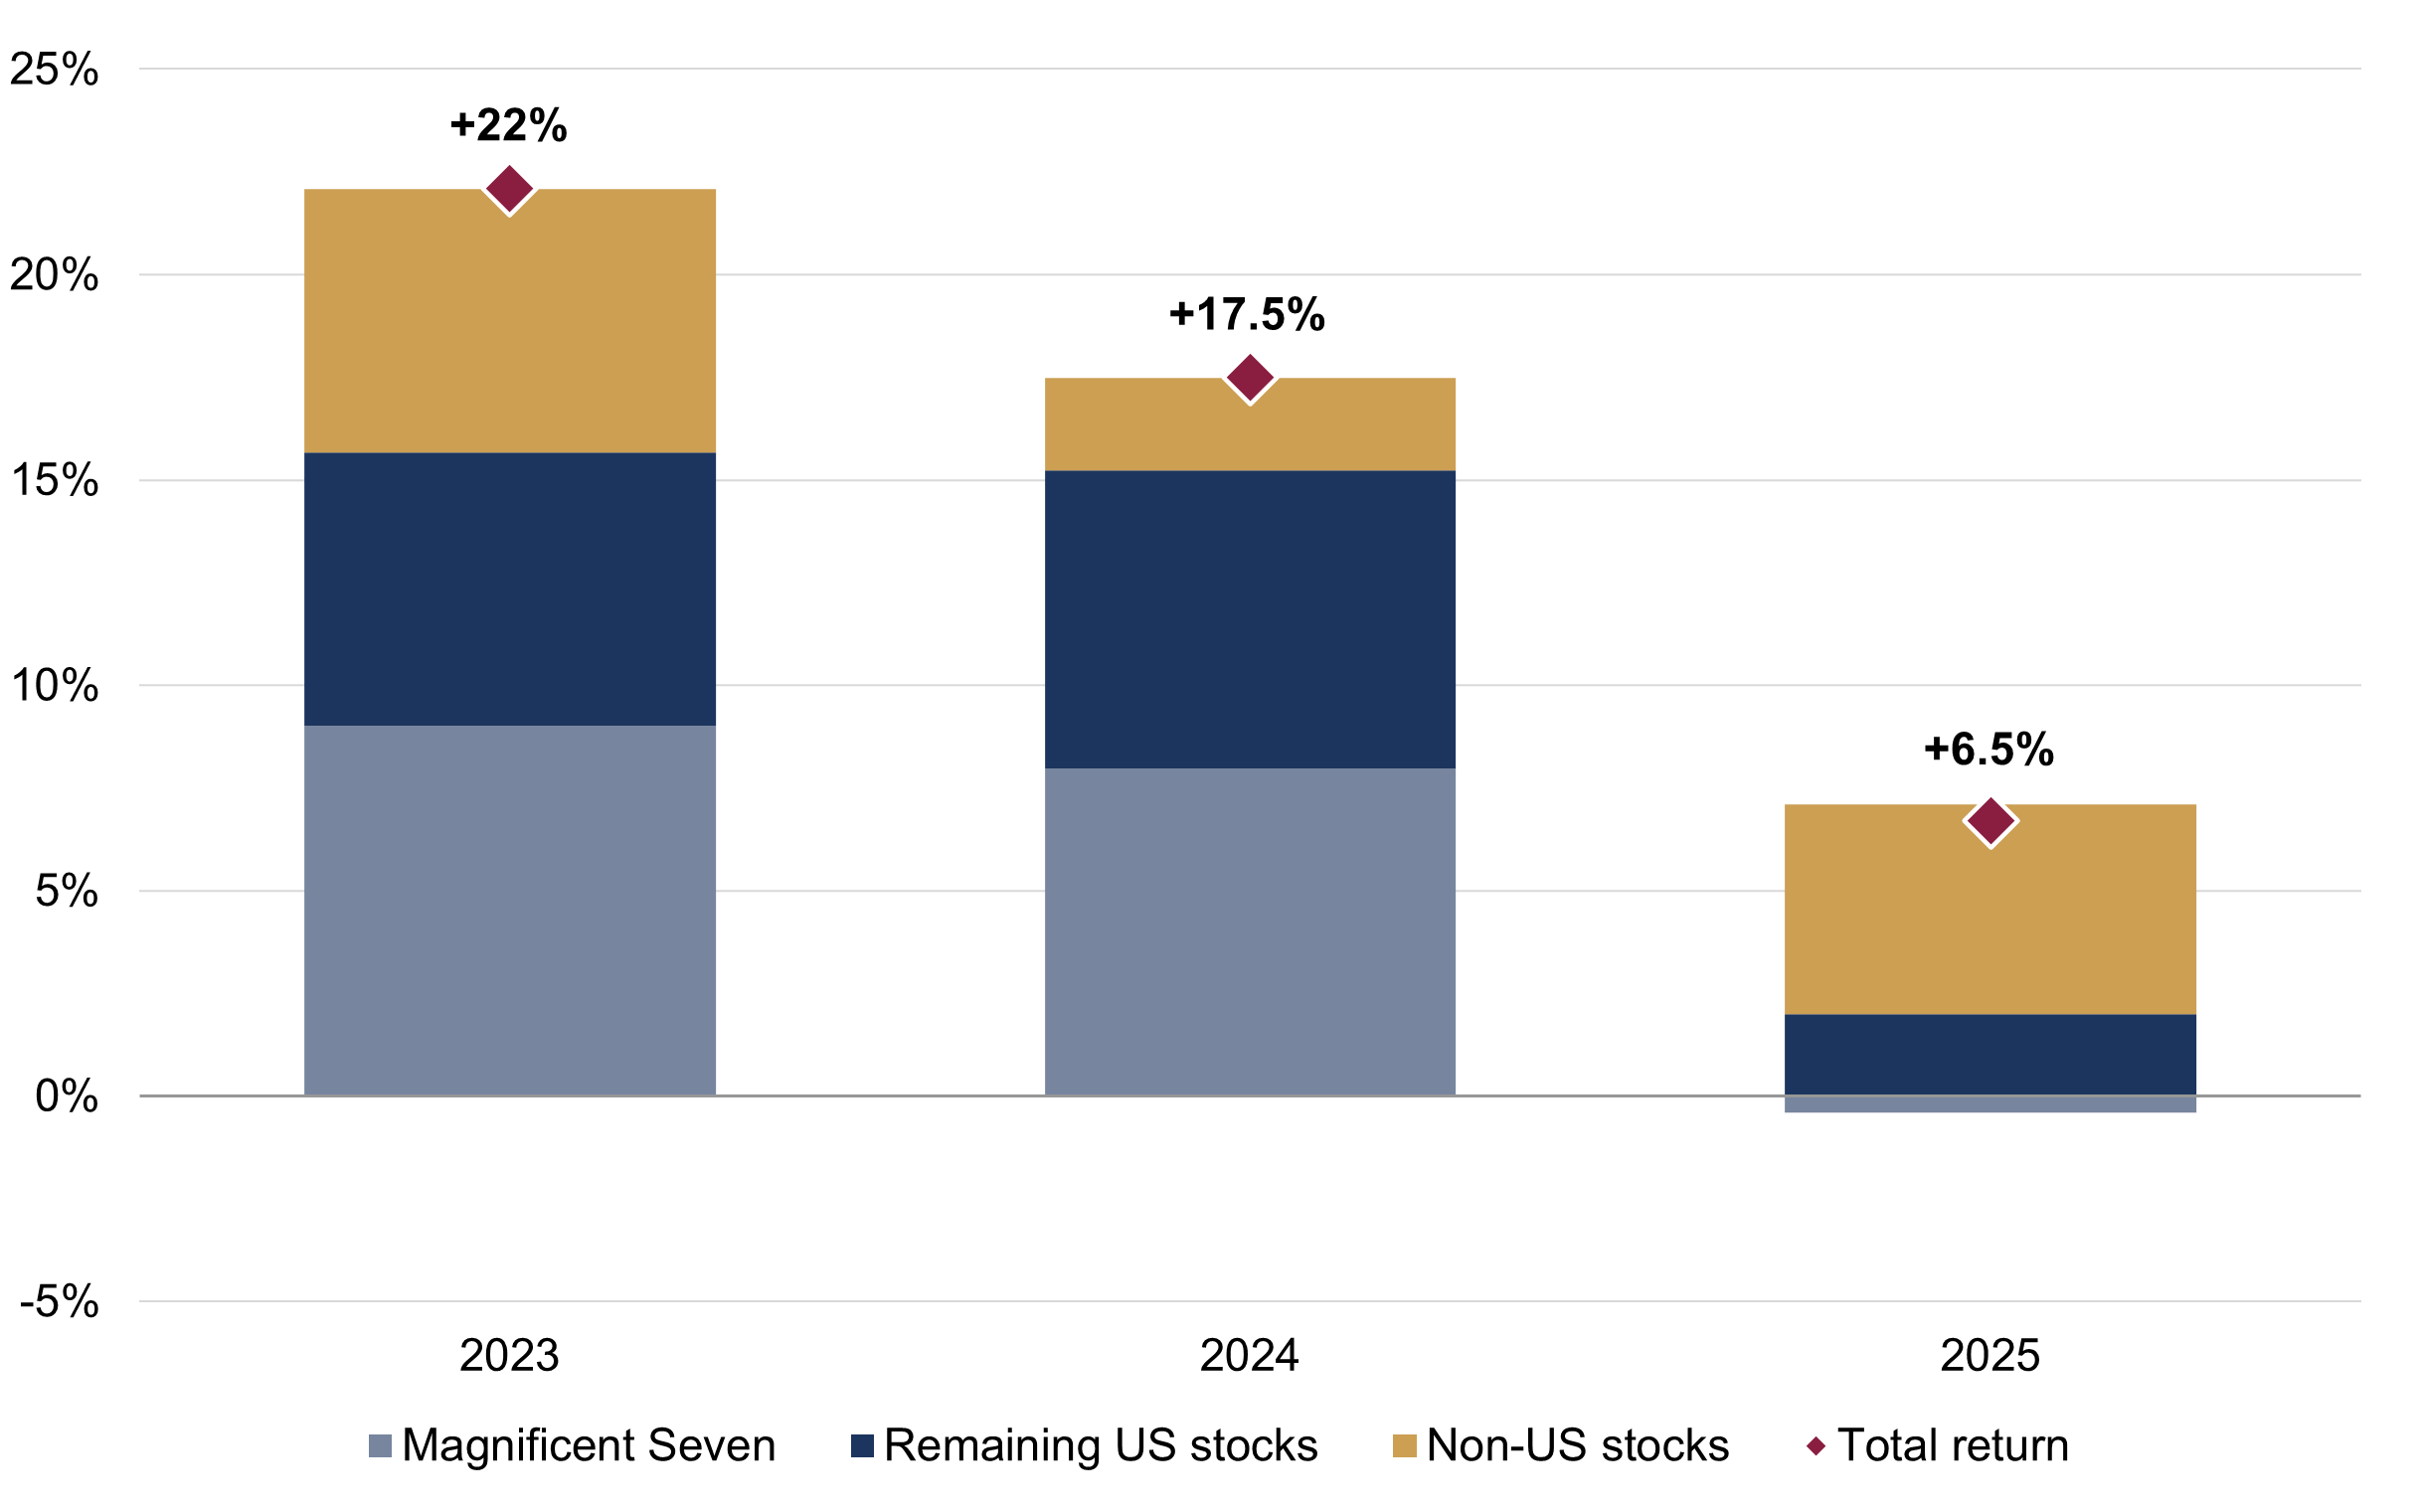
Source: Rothschild & Co, Bloomberg, MSCI. Note: Magnificent Seven are Alphabet, Amazon, Apple, Meta, Microsoft, Nvidia and Tesla. Annual return figures are rounded to the nearest ½.
3. Volatility picks up
Stock markets have been more volatile in 2025, following a subdued couple of years. For example, the S&P 500’s daily moves have exceeded 2% (in absolute terms) more times already this year than in 2023 and 2024 combined (figure 3). Remarkably, the S&P 500 rose by 9.5% on 9 April when Trump paused his ‘Liberation Day’ tariffs, its largest positive daily move since 2008. However, this year’s stock volatility does not appear that extreme (using the metric in figure 3 at least): volatility was unusually muted in 2023 and 2024, and most of this year’s sharp moves were clustered together in April when tariff risk moved into focus.
Figure 3: S&P 500 daily price changes
Number of days per year (greater than +2% / less than -2%)
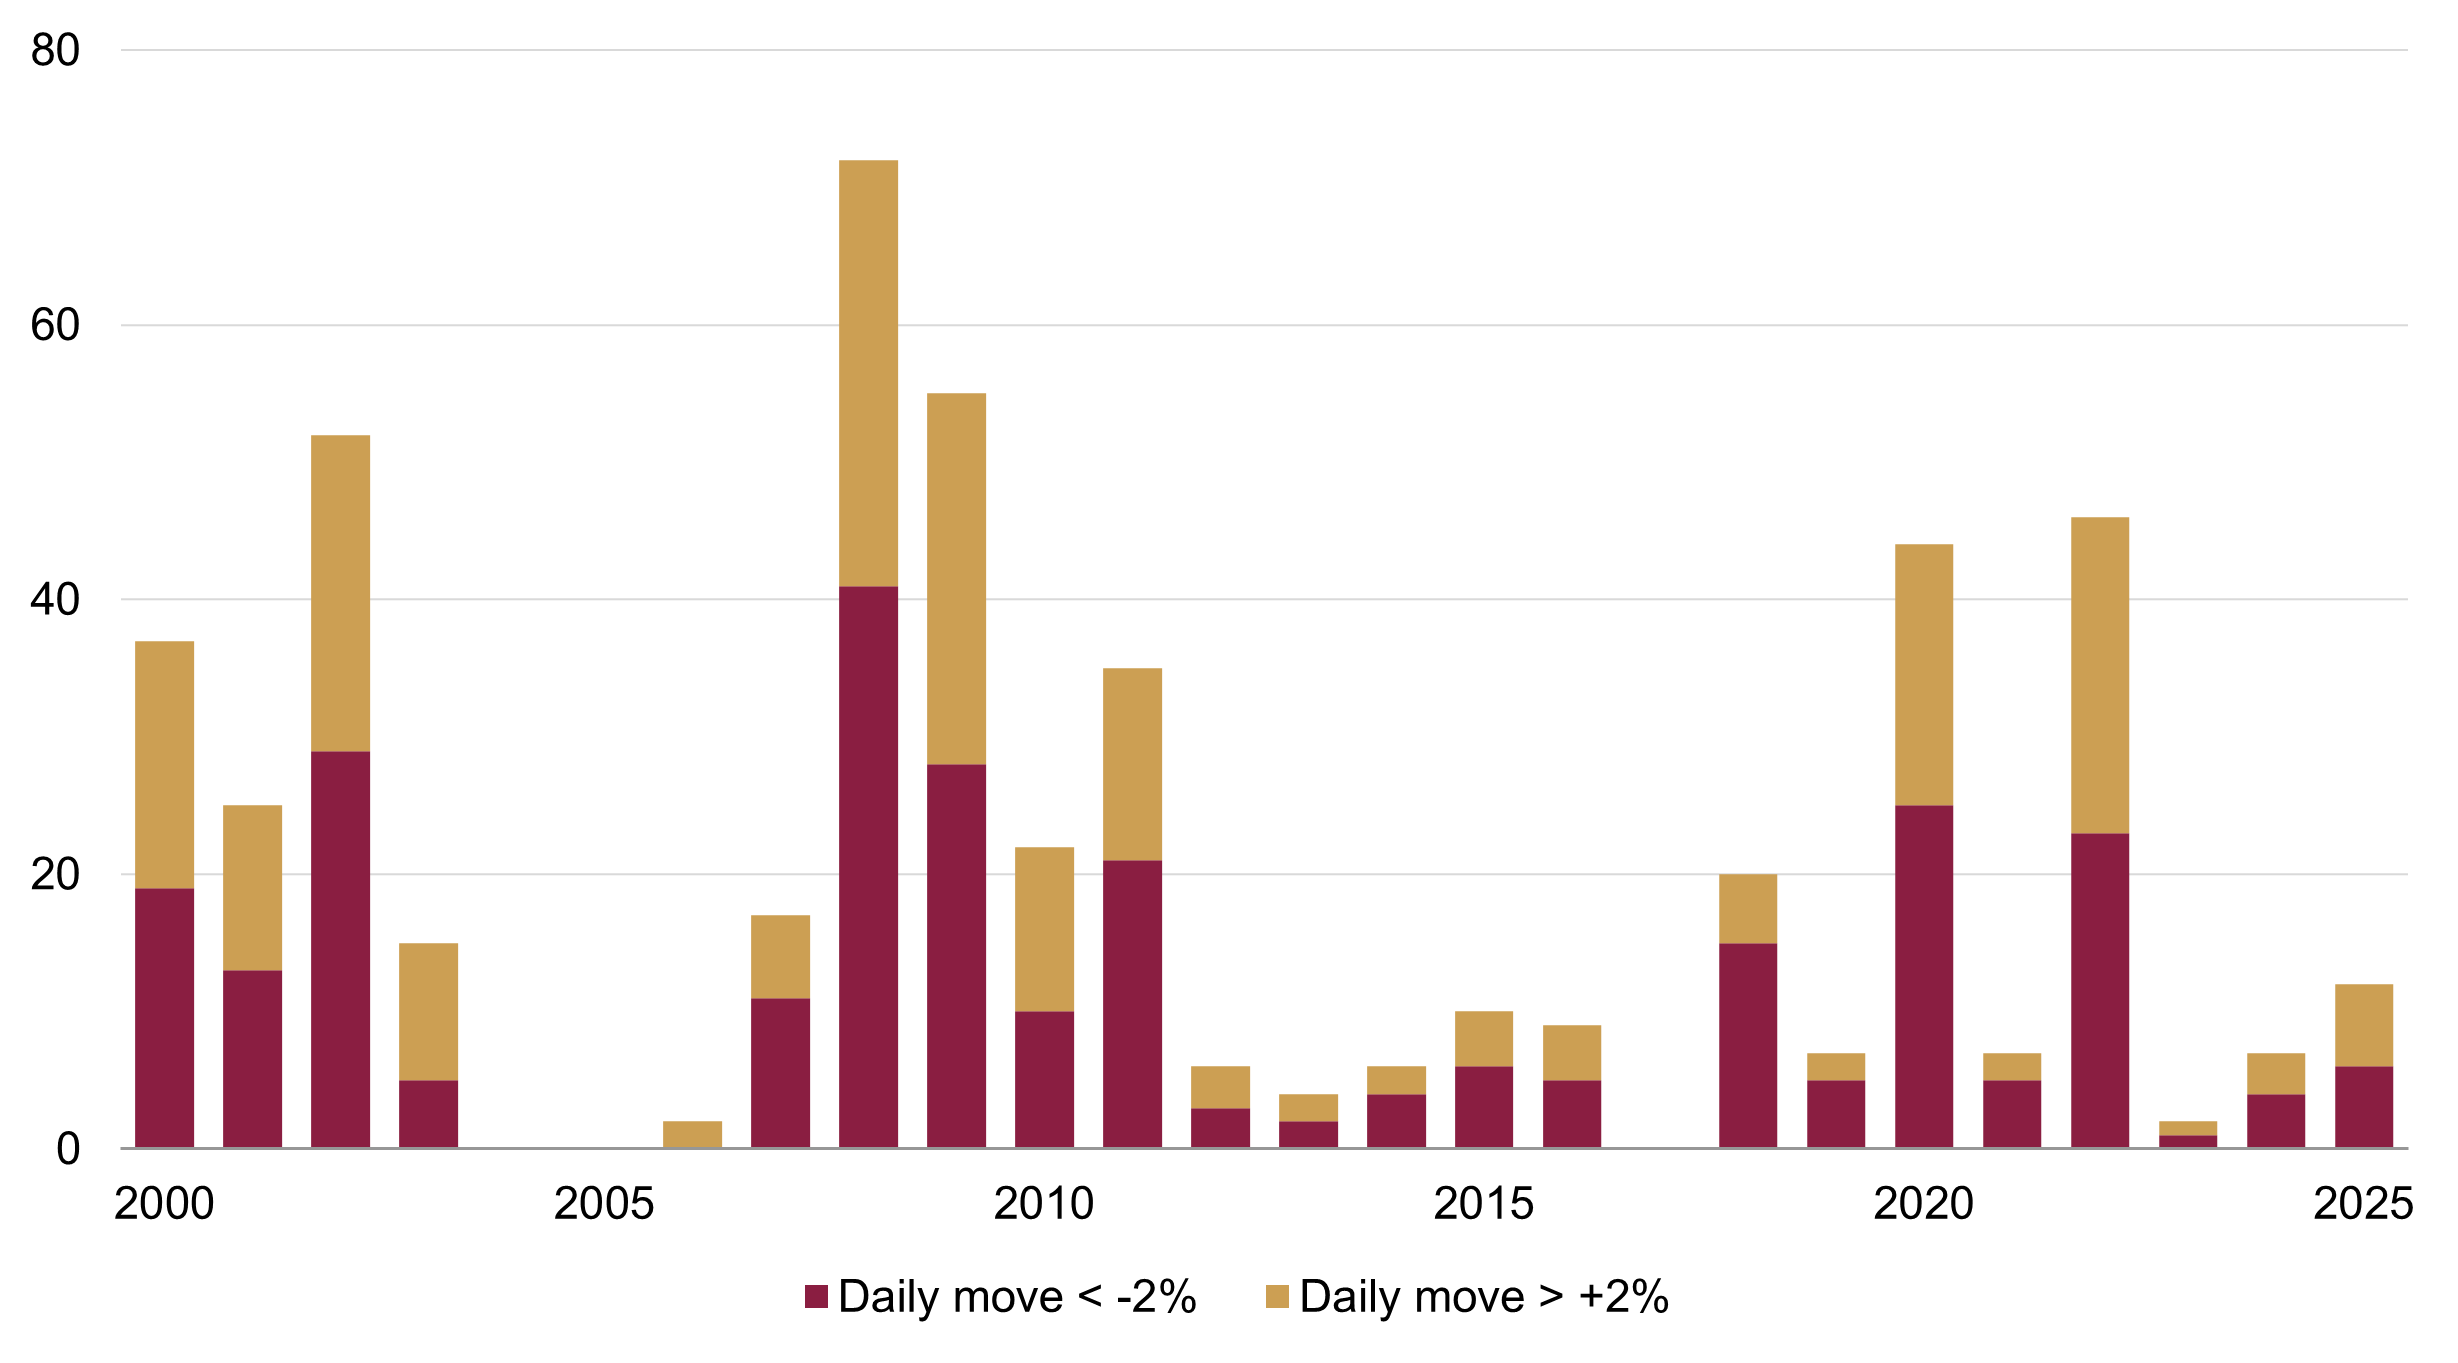
Source: Rothschild & Co, Bloomberg
4. Valuations are expensive, but not outlandish
Following that sharp – but brief – stock market sell-off in April, global stocks appear expensive again (figure 4). The global cyclically-adjusted price-to-earnings (CAPE) ratio2 – our preferred long-term stock market valuation metric – is roughly 1.5 standard deviations above its 10-year average (for context, the global CAPE only fell to its perceived ‘fair value’ – its 10-year trend – when the price index bottomed on 8 April). However, as we’ve noted before, valuations are not a good short-term market timing tool: they may be more useful when at extreme highs or lows, as the market may be riper for reversal, but that does not appear to be the case today. For instance, both the global CAPE multiple and its deviation from trend have been much higher in the past – most visibly during the dot-com bubble.
Figure 4: Global cyclically-adjusted price-to-earnings ratio
(x)
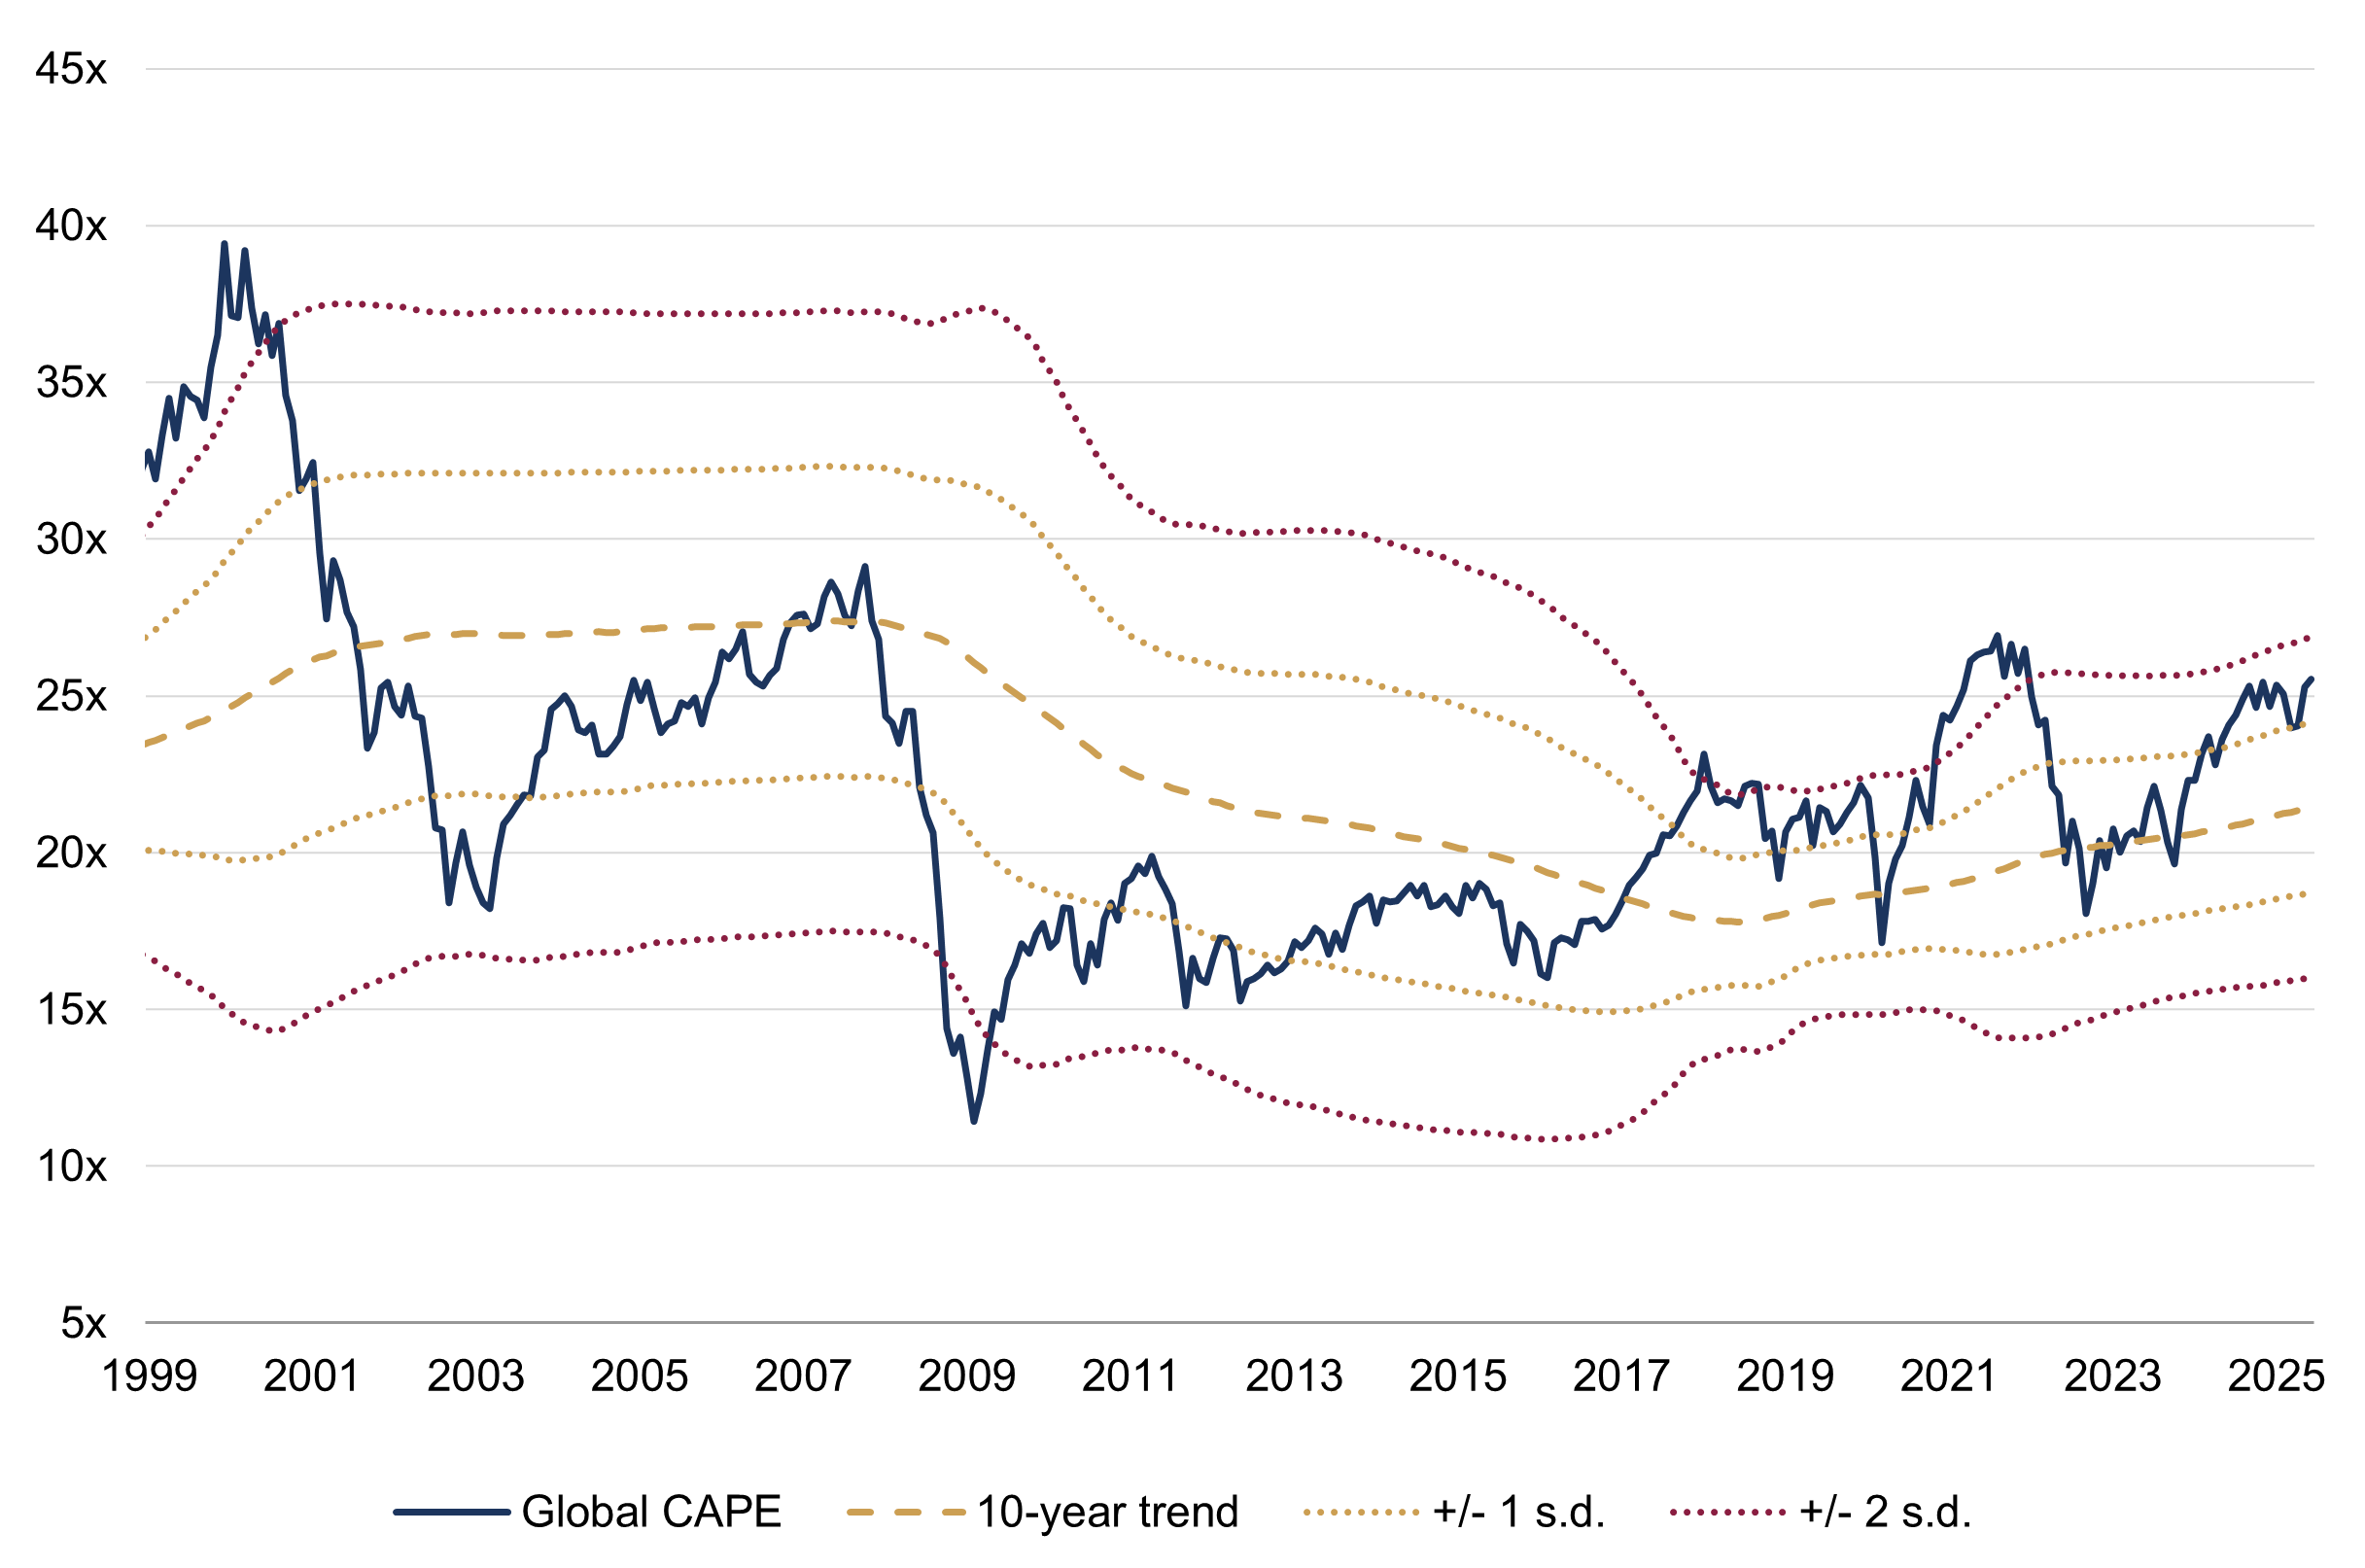
Source: Rothschild & Co, Bloomberg, LSEG Datastream, I/B/E/S, MSCI. Note: Chart is based on monthly data, so does not show the global CAPE low on 8 April which is referred to in the text.
5. Earnings growth appears intact for now
Global earnings momentum persisted through the first quarter of 2025, following last year’s rebound. Analysts were indeed anticipating a healthy earnings backdrop, but estimates have been revised lower since the start of the year, likely due to tariffs, uneasy geopolitics and arithmetic (on the latter, downgrades to 2025 earnings estimates prior to ‘Liberation Day’ were offset by upgrades to 2024 and 2026 earnings estimates). Even so, global earnings are still expected to grow at a respectable pace in 2025 (figure 5). While tariff risk has not disappeared, hawkish US trade policy has at least moderated in recent months which may limit the hit to economic growth and corporate earnings. Further details will of course be unveiled in early July, when Trump announces the outcome of those paused ‘reciprocal’ tariffs…
Figure 5: Global earnings per share growth estimates’ evolution
Analyst estimates by calendar year (%)
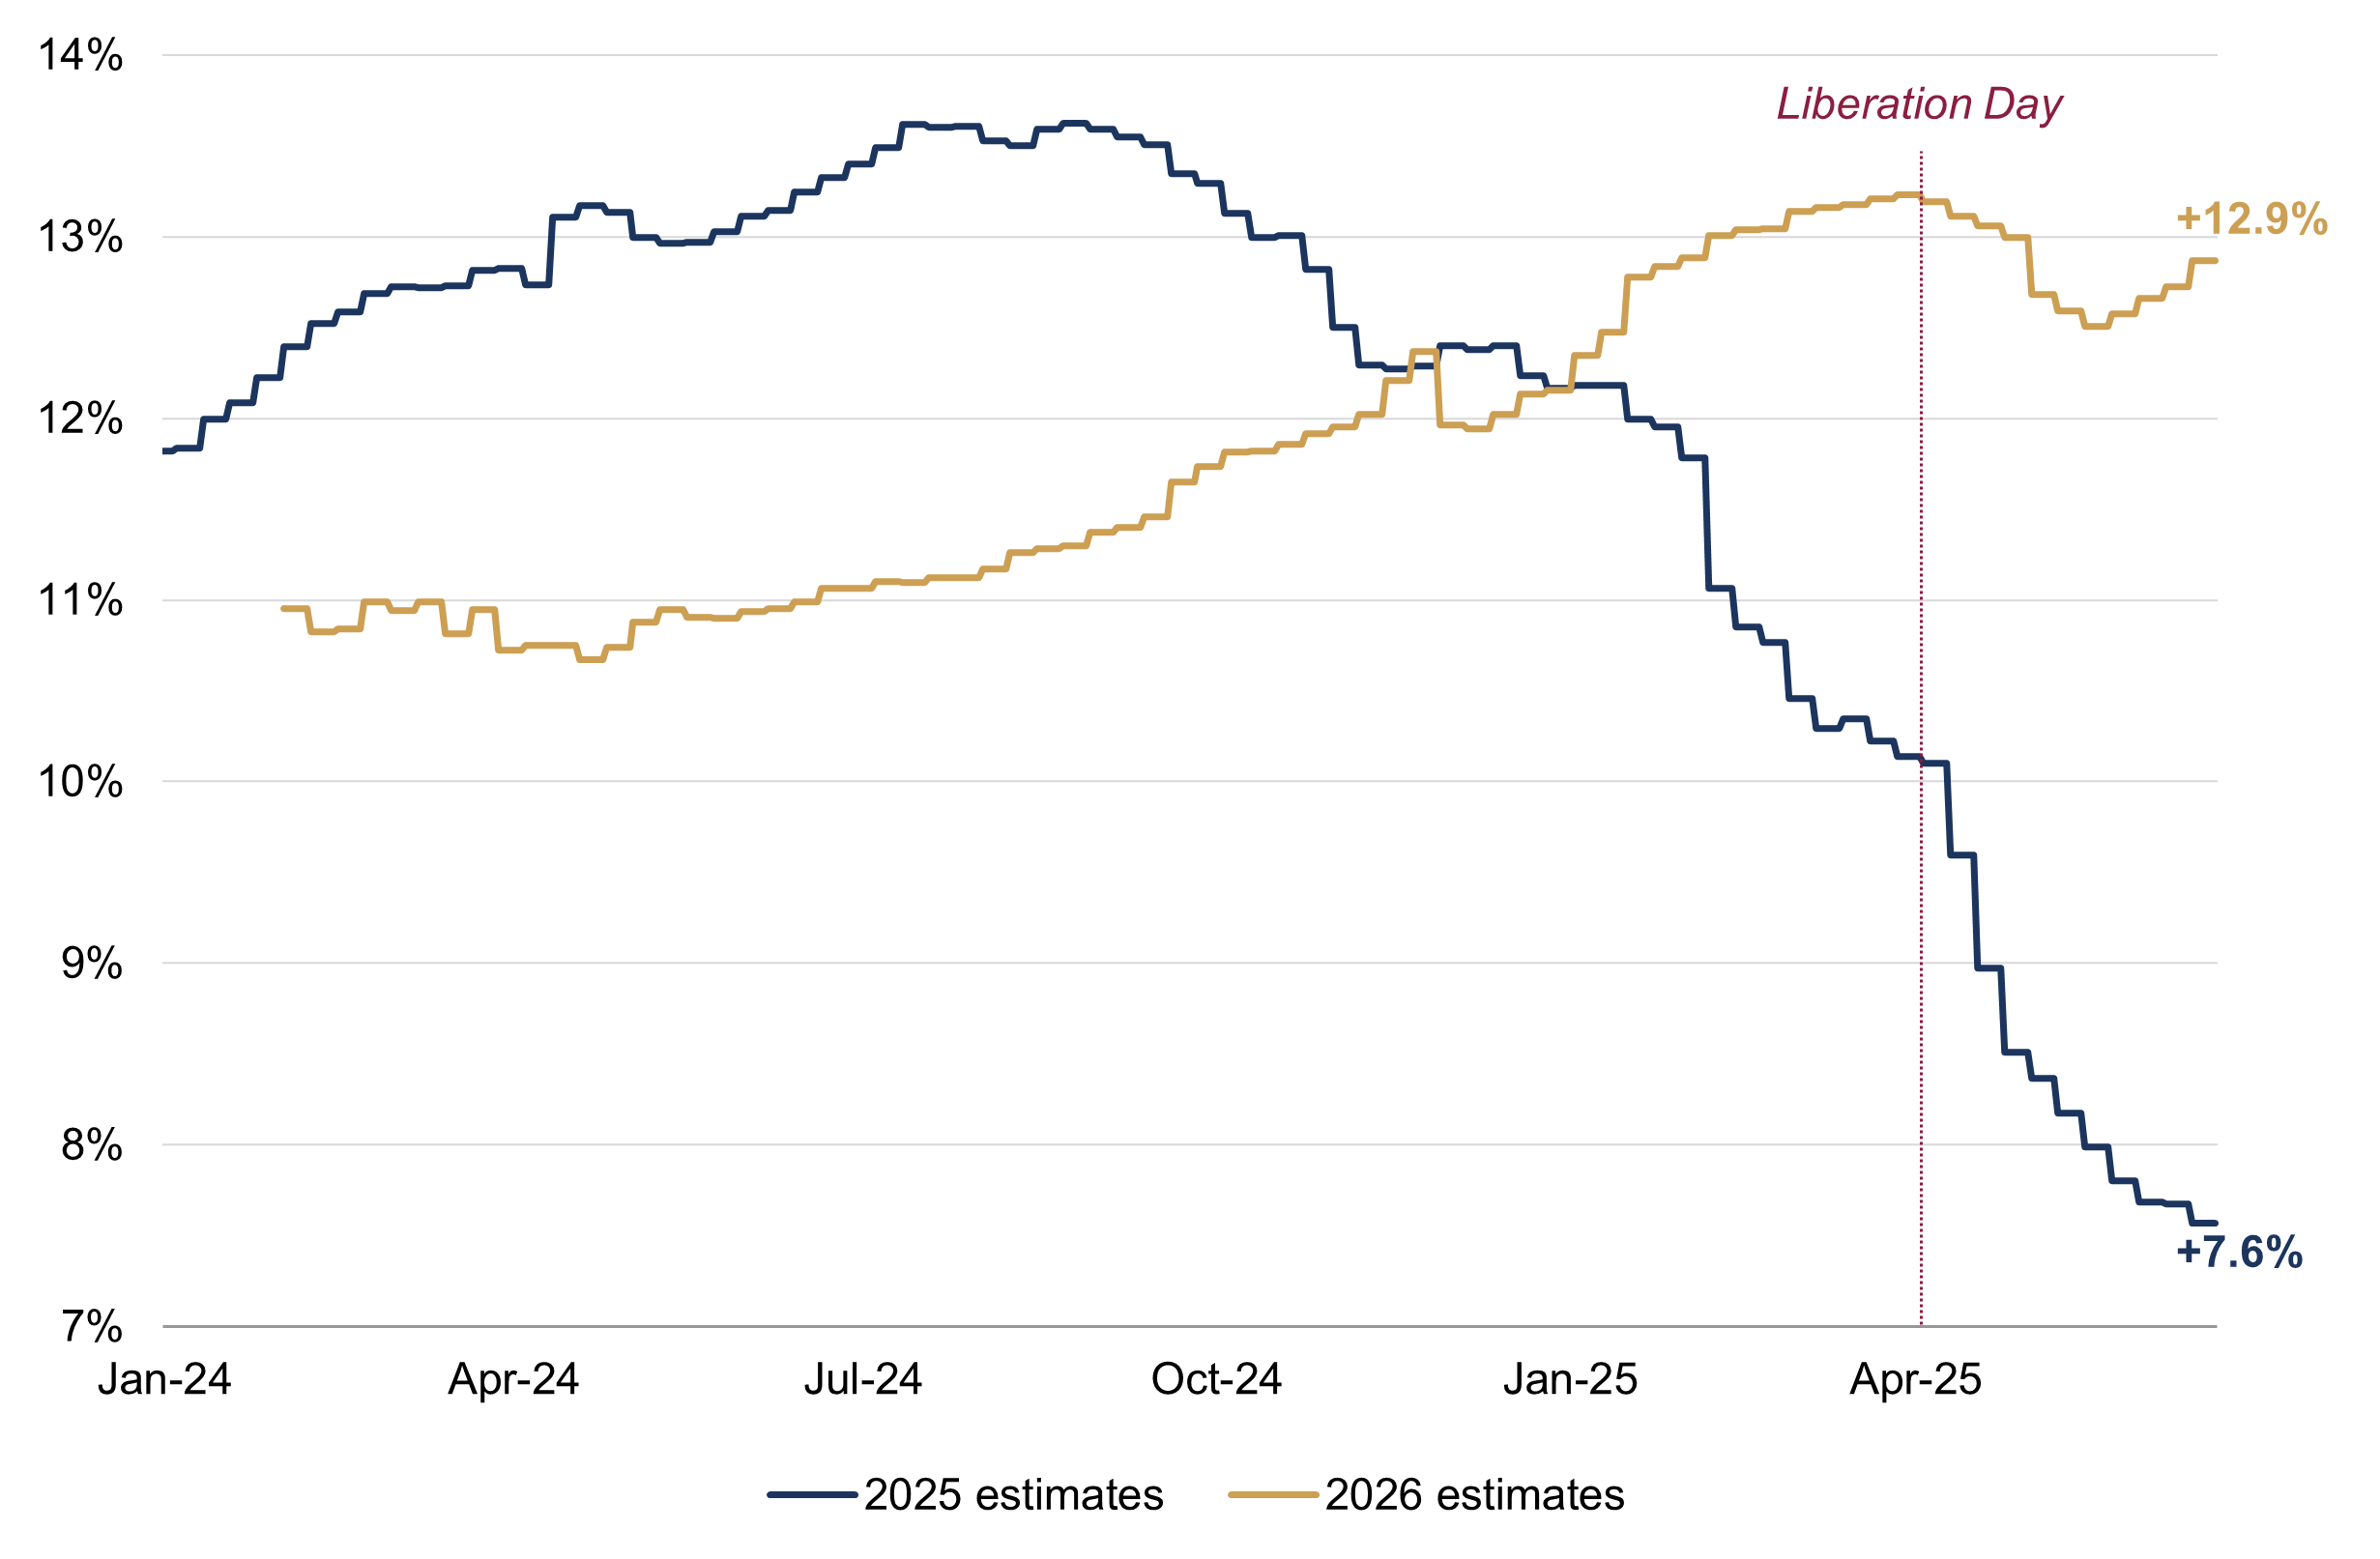
Source: Rothschild & Co, LSEG Datastream, I/B/E/S, MSCI
Ready to begin your journey with us?
Speak to a Client Adviser in the UK or Switzerland
Citations
All charts/data as of 18 June 2025.
[1] Alphabet, Amazon, Apple, Meta, Microsoft, Nvidia and Tesla
[2] Inflation adjusted price of an index divided by the inflation-adjusted 10-year trend in trailing (historic) earnings.
Past performance is not a guide to future performance and nothing in this article constitutes advice. Although the information and data herein are obtained from sources believed to be reliable, no representation or warranty, expressed or implied, is or will be made and, save in the case of fraud, no responsibility or liability is or will be accepted by Rothschild & Co Wealth Management UK Limited as to or in relation to the fairness, accuracy or completeness of this document or the information forming the basis of this document or for any reliance placed on this document by any person whatsoever. In particular, no representation or warranty is given as to the achievement or reasonableness of any future projections, targets, estimates or forecasts contained in this document. Furthermore, all opinions and data used in this document are subject to change without prior notice.