
Strategy blog: Five observations from stock markets

So far, so good. The global stock market has risen by 15% this year (MSCI ACWI in US dollar terms) and is only 7% below its all-time high. In this post, we flag five eye-catching observations from stock markets in 2023.
-
Last year's losers have been this year's winners
After falling by almost a quarter last year in US dollar terms, 'growth' stocks have outperformed their 'value' counterparts, while cyclical stocks have rebounded against more defensive ones (in relative terms they are both roughly 10% below January 2022 levels). Technology, Communication Services and Consumer Discretionary – the worst performing sectors in 2022 – are leading the pack higher, having risen by more than 30% this year¹. Industrials – usually viewed as a cyclical industry – is the only other sector with double-digit returns in 2023 (+15%).
Chart 1: MSCI ACWI Growth vs Value & Cyclicals vs Defensives
Total return indices, USD terms, Jan '22 = 100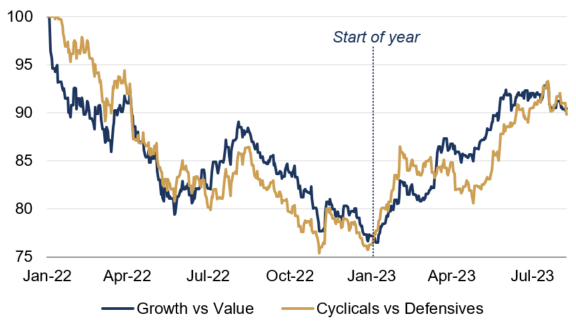
Source: Rothschild & Co, Bloomberg
Note: ¹ Based on MSCI World sector indices
-
The (re)emergence of narrow leadership
Seven large-cap 'technology' stocks – Alphabet, Amazon, Apple, Meta, Microsoft, Nvidia and Tesla – have accounted for most of the S&P 500's 18% year-to-date return. At a global level, the contribution has also been significant, with the "Magnificent Seven" accounting for almost 40% of the MSCI ACWI's total return. Narrow leadership is not a new phenomenon – and participation may continue to broaden in the coming months – but this year is still one of the most concentrated the US index has been over the past three decades².
Chart 2: S&P 500 year-to-date return and contribution
Total return, USD terms, %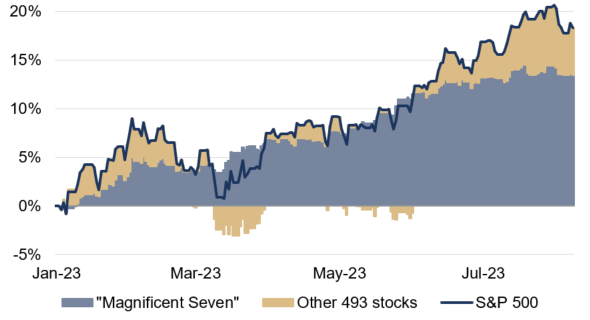
Source: Rothschild & Co, Bloomberg
Note: ² Assuming the year ended today, the top seven stocks have had the largest contribution to the S&P 500's total return in any calendar year over the past three decades (1990-2023 analysis).
-
Volatility has been relatively low
Contrary to bond markets, stock index volatility has been muted this year: the VIX Index – an implied volatility gauge of the S&P 500 – recently fell to its lowest level since January 2020. Ex-post volatility has also been quiescent: there have only been two trading days this year where the S&P 500's daily price changes have been greater than 2% (in absolute terms), compared to 46 days in 2022. The MSCI ACWI has yet to break the daily +2%/-2% threshold this year.
Chart 3: S&P 500 daily price changes greater than 2% or less than -2%
Number of days per year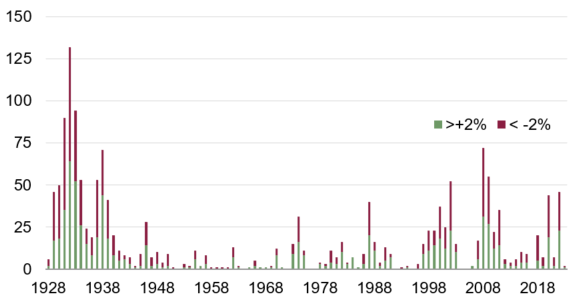
Source: Rothschild & Co, Bloomberg
-
Corporate earnings have softened, not collapsed
Earnings have stagnated in 2023, amid higher interest rates and unfavourable base effects for energy and commodity-related sectors. But this is far from a big collapse in corporate earnings: the 'peak-to-trough' EPS decline has only been 4% at a global level (on a trailing 12-month basis). During the pandemic the equivalent drawdown was 24%, and nearly double that during the Global Financial Crisis. Moreover, looking ahead, analysts expect earnings growth to resume in 2024 and 2025.
Chart 4: MSCI ACWI 12-month trailing EPS
US dollar terms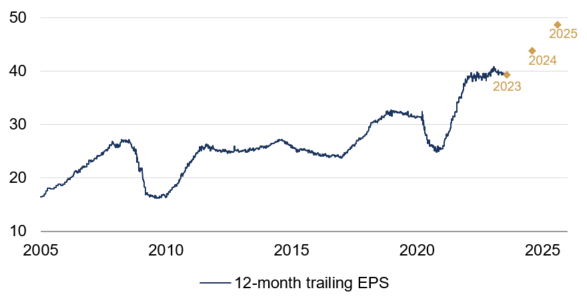
Source: Rothschild & Co, Refinitiv Datastream, I/B/E/S
Note: Bronze dots are analyst EPS expectations for fiscal years 2023, 2024 and 2025
5. Valuations are not excessive
Global equities have travelled a long way since their October 2022 low, but valuation-wise they remain inexpensive (in their own terms). At a global level, the cyclically-adjusted price-to-earnings ratio (CAPE) – our preferred measure which compares inflation-adjusted stock prices with the 10-year average in inflation-adjusted earnings – is only slightly above its long-term trend. Even the lumpier 12-month forward price-to-earnings ratio is only just above its 10-year average. The prospect of a revival in earnings growth in 2024 may yet justify the valuation-driven re-rating witnessed this year.
Chart 5: MSCI ACWI Cyclically Adjusted Price-Earnings Ratio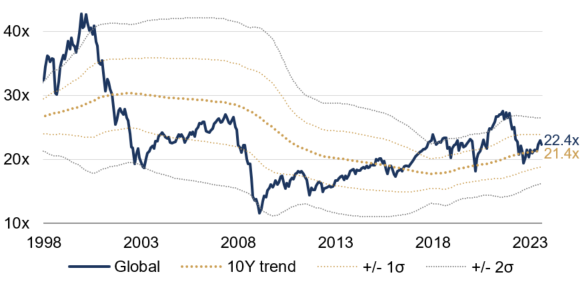
Source: Rothschild & Co, Bloomberg, Refinitiv Datastream
Charts/data as of 8th August 2023
Read more articles
-

The perils of making predictions
Quarterly Letter
History is littered with examples of people making predictions that later turned out to be inaccurate. How can we become better at forecasting the future? Our Quarterly Letter delves into this topic to investigate some of the perils of making predictions.
-

Rothschild & Co’s UK Wealth Management business names James Morrell as Deputy CEO
Press releases
The newly created Deputy CEO role will provide increased capacity at a senior level to help meet the growing demand for Rothschild & Co’s wealth management services from existing and future clients.
-

Rothschild & Co wins Western Europe's Best Bank for Advisory from Euromoney
Awards
This is the second consecutive year we have been named Western Europe's Best Bank for Advisory, reflecting the breadth of our capabilities across M&A and financing advisory across the region.
-

Growth Equity Update
Insights
The July edition assesses the condition of Growth Equity at the year’s halfway stage. H1 was again tough for fundraising for VC firms. Q2 though was much stronger than Q1 and into July with the mood amongst VC funds, and their fundraising, bolstered by the surge in appetite for AI related investments.
-

Rothschild & Co hires Brandon Aebersold and Parry Sorensen as Managing Directors in North America
Press releases
Senior hires bolster the firm’s Restructuring team in the United States.
-

Asset Management: Monthly Macro Insights - July 2024
Market Commentary
Business confidence fell at the end of Q2-24, casting doubts on the positive momentum going into the second half of the year, while rising political uncertainty add to an already complicated conduct of monetary policy.