Strategy blog - Industrial unrest: back to the 1970s?
Industrial action has been increasing this year. Real wage growth has fallen into negative territory across most big economies as headline inflation rates have touched multi-decade highs, and labour is understandably trying to protect its living standards by striking for higher pay.
There is much talk of parallels with the 1970s – particularly here in the UK, with some commentators likening the situation to the Winter of Discontent in 1978-9.
We think the parallels are exaggerated.
There are data which track 'working days lost to work stoppages/industrial action' for the US and UK, and for the UK they have just been updated – partially, see Chart 2 – for the first time since 2019.
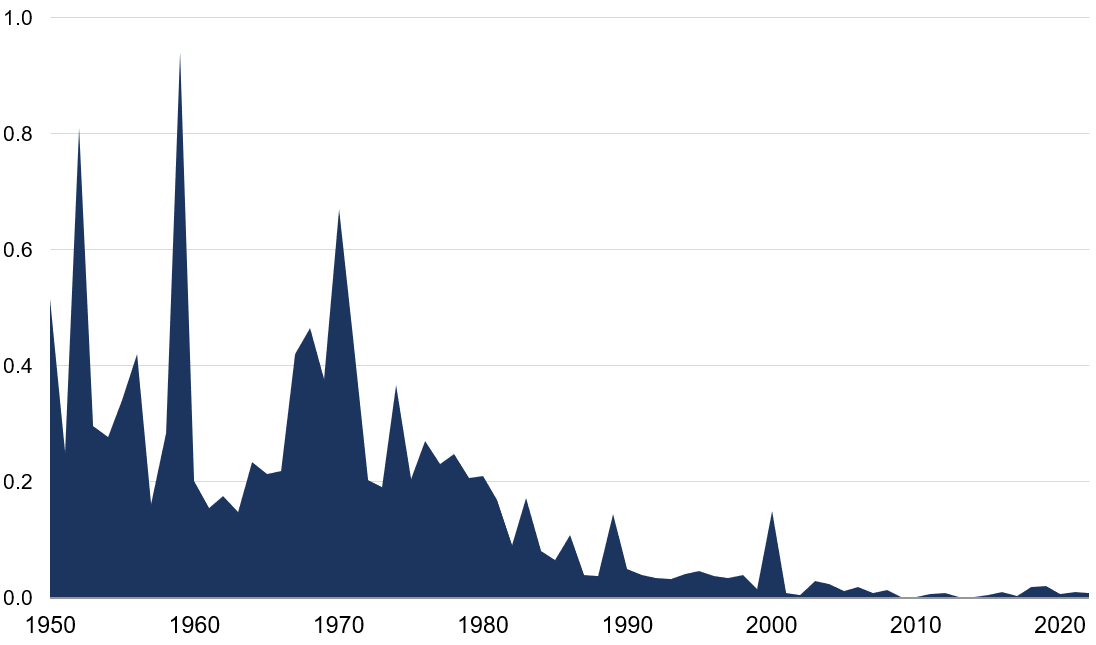
In the US, where we now have data to November, this year's industrial unrest continues to look unremarkable even by the standards of the post-2000 years – and it remains well below pre-1990 levels (at least to November).
Chart 1: US annual working days lost to work stoppages (per employed person)
Source: Rothschild & Co, Refinitiv Datastream, US Bureau of Labor Statistics
Footnote: Data to November 2022.
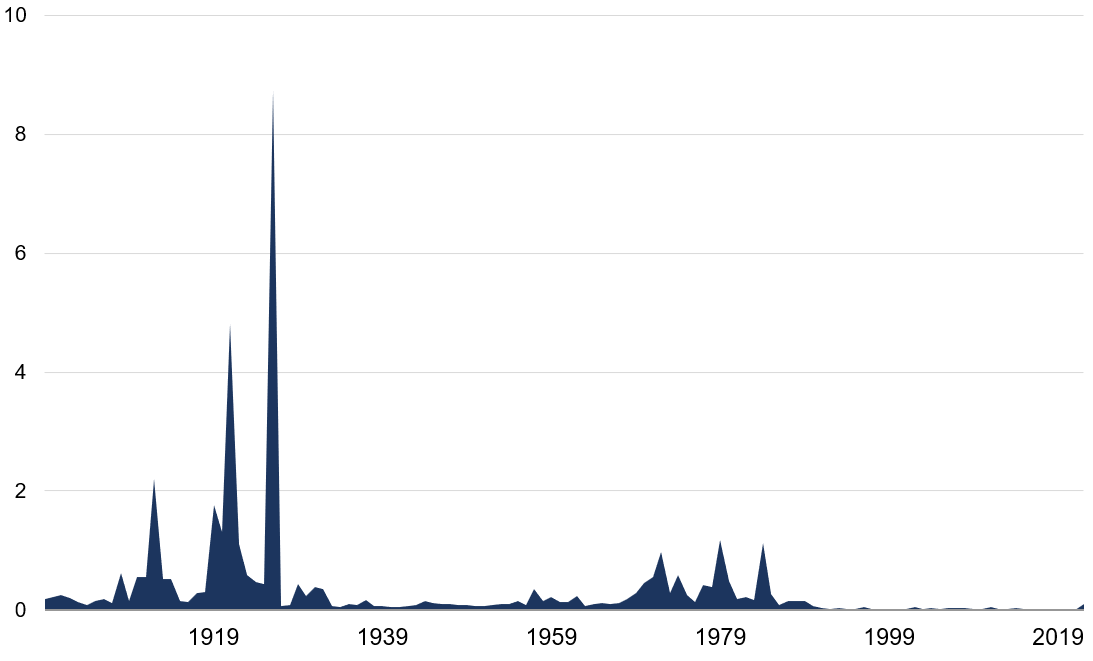
Recent UK data are patchier: the Office for National Statistics unfortunately stopped publishing the series between 2020 and mid-2022. But there are now figures for Q3, and we can make an informed estimate for Q4 and annualise these two quarters. The number of days lost is higher than in recent years, but again looks unremarkable in the longer-term context.
Chart 2: UK annual working days lost to industrial action (per employed person)
Source: Rothschild & Co, Refinitiv Datastream, Bank of England, UK Office for National Statistics
Footnote: The 2022 estimate is an annualised figure based on the available June-September data, and assuming a further big increase in Q4.
The estimated 2022 datapoint is barely visible on the chart – and not just by comparison with the towering total for 1926's General Strike, but more importantly by comparison with the experience of the 1970s. Labour markets have experienced many structural changes over the years. Unionisation is lower, employers are better managers, the legal framework governing strikes is more restrictive (no more secondary picketing or informal walkouts). Collective wage agreements are scarcer. Globalisation has boosted the global pool of labour. The composition of output has changed hugely; most recently, working practices have changed with remote working. Of course, the situation might yet deteriorate dramatically. But as yet, we think the echoes from the 1970s remain distant ones only. And if headline inflation does turn down markedly in 2023, and eventually dips below pay growth, the upward pressure will begin to fade.
Ready to begin your journey with us?
Past performance is not a guide to future performance and nothing in this blog constitutes advice. Although the information and data herein are obtained from sources believed to be reliable, no representation or warranty, expressed or implied, is or will be made and, save in the case of fraud, no responsibility or liability is or will be accepted by Rothschild & Co Wealth Management UK Limited as to or in relation to the fairness, accuracy or completeness of this document or the information forming the basis of this document or for any reliance placed on this document by any person whatsoever. In particular, no representation or warranty is given as to the achievement or reasonableness of any future projections, targets, estimates or forecasts contained in this document. Furthermore, all opinions and data used in this document are subject to change without prior notice.