


 51 / 204

Rothschild & Co | Annual Report 2017
49
1. Overview
4. Financial statements
3.
Management report
2. Business review
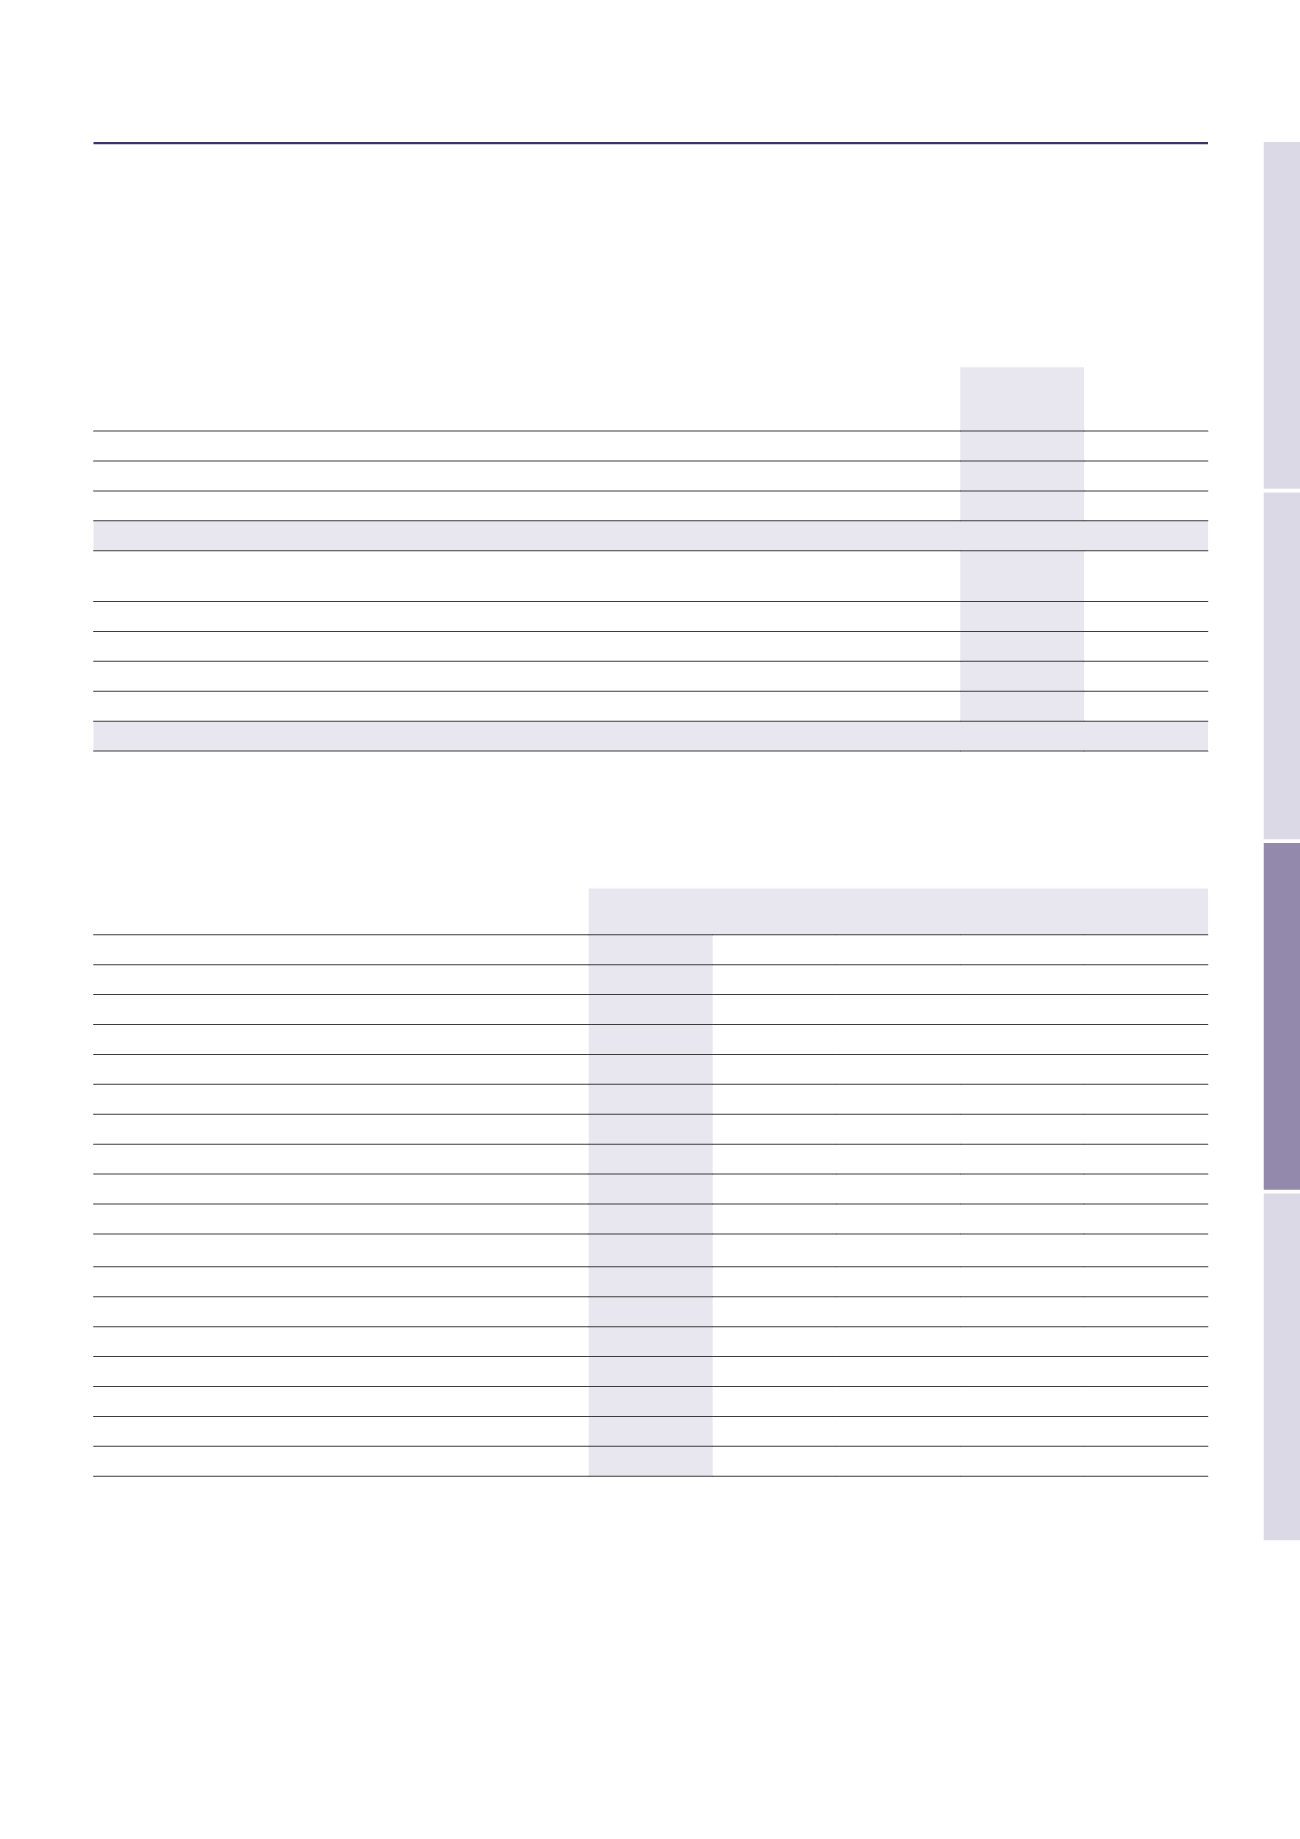
2 Summary presentation of the results of the Company (solo accounts)
2.1 Results of the 2017 financial year
In millions of euro
01/04/17
31/12/17
(9 months)
01/04/16
31/03/17
(12 months)
INCOME STATEMENT
Current income before tax
110
59
Income from capital transactions
2
(2)
Net income
(
1)
122
61
BALANCE SHEET
Balance sheet total
1,923
1,845
Non-current financial assets
1,701
1,700
Current assets
213
136
Borrowings and other financial liabilities
132
95
Shareholders’ equity
1,666
1,595
(1) Net income is post tax. Please refer to Note 20 of the solo accounts of the Company on page 189 for more details.
The solo accounts of the Company for the 2017 financial year are set out on pages 181 onwards of this report.
2.2 Results of the past five financial years
In euro
31/12/17
(9 months)
31/03/17
(12 months)
31/03/16
(12 months)
31/03/15
(12 months)
31/03/14
(12 months)
I – Financial position at the end of the financial year
a) Share capital
154,815,024 154,580,024 142,274,072 142,274,072 142,208,216
b) Number of shares and investment certificates issued
77,407,512 77,290,012 71,137,036 71,137,036 71,104,108
c) Maximum number of future shares to be created
–
–
–
–
–
II – Overall result of effective operations
a) Revenues exclusive of tax (financial and operating income)
127,139,989 88,576,446
(2)
68,170,967 26,542,974 25,238,744
b) Income before tax, amortisation and provisions
113,649,623 52,866,266 63,837,937 8,507,693 6,478,796
c) Corporate income tax
(1)
(8,981,132)
(3,885,460)
2,580,799 (3,832,636)
(2,029,187)
d) Income after tax, amortisation and provisions
121,763,776 60,712,772 61,498,968 11,764,158 9,985,781
e) Distributed income, excluding treasury shares
52,637,108
(3)
52,557,208 44,562,497 42,423,795 35,233,340
III – Earnings per share data
a) Income after tax, but before amortisation and provisions
1.58
0.73
(2)
0.93
0.07
0.06
b) Income after tax, amortisation and provisions
1.57
0.79
0.86
0.17
0.14
c) Dividend per share
0.68
(3)
0.68
0.63
0.60
0.50
IV – Employees
a) Average employee headcount
18
19
23
25
29
b) Total of the payroll
1,992,491 3,036,180 3,164,335 3,451,711 5,230,484
c) Total employee benefits (social security, welfare, etc.)
858,405 1,764,709 1,816,360 1,595,239 2,887,383
(1) Negative amounts correspond to tax benefits.
(2) Adjusted amount compared to the 2016/2017 Management Report.
(3) Dividend proposed to General Meeting of shareholders of 17 May 2018.